Arun Sharma Test: Pie Chart- 1 - CAT Prep Free MCQ with solutions
MCQ Practice Test & Solutions: Arun Sharma Test: Pie Chart- 1 (5 Questions)
You can prepare effectively for CAT Crash Course for CAT with this dedicated MCQ Practice Test (available with solutions) on the important topic of "Arun Sharma Test: Pie Chart- 1". These 5 questions have been designed by the experts with the latest curriculum of CAT 2026, to help you master the concept.
Test Highlights:
- - Format: Multiple Choice Questions (MCQ)
- - Duration: 7 minutes
- - Number of Questions: 5
Sign up on EduRev for free to attempt this test and track your preparation progress.

The following pie-charts show the distribution of students of graduate and post-graduate levels in seven different institutes in a town.
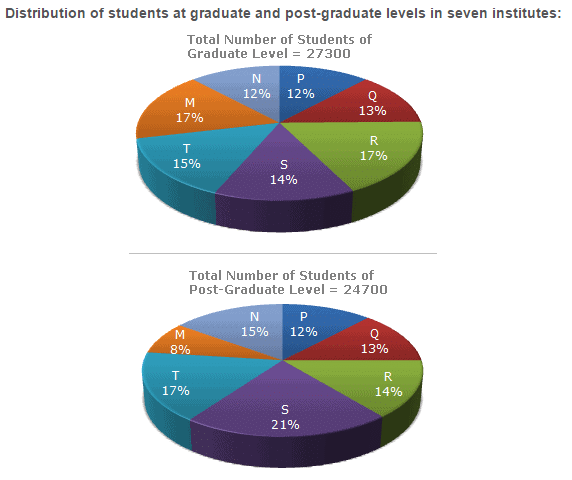
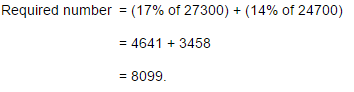
What is the total number of graduate and post-graduate level students is institute R?
Detailed Solution: Question 1
The following pie-charts show the distribution of students of graduate and post-graduate levels in seven different institutes in a town.
What is the ratio between the number of students studying at post-graduate and graduate levels respectively from institute S?
Detailed Solution: Question 2

The following pie-charts show the distribution of students of graduate and post-graduate levels in seven different institutes in a town.
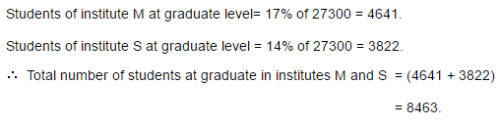
How many students of institutes of M and S are studying at graduate level?
Detailed Solution: Question 3
The following pie-charts show the distribution of students of graduate and post-graduate levels in seven different institutes in a town.
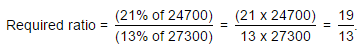
What is the ratio between the number of students studying at post-graduate level from institutes S and the number of students studying at graduate level from institute Q?
Detailed Solution: Question 4
The following pie-charts show the distribution of students of graduate and post-graduate levels in seven different institutes in a town.
Total number of students studying at post-graduate level from institutes N and P is
Detailed Solution: Question 5
694 videos|32 tests |