Table Charts - 2 - Free MCQ Practice Test with solutions, SSC CGL Quant
MCQ Practice Test & Solutions: MCQ: Table Charts - 2 (15 Questions)
You can prepare effectively for SSC CGL Quantitative Aptitude for SSC CGL with this dedicated MCQ Practice Test (available with solutions) on the important topic of "MCQ: Table Charts - 2". These 15 questions have been designed by the experts with the latest curriculum of SSC CGL 2026, to help you master the concept.
Test Highlights:
- - Format: Multiple Choice Questions (MCQ)
- - Duration: 15 minutes
- - Number of Questions: 15
Sign up on EduRev for free to attempt this test and track your preparation progress.

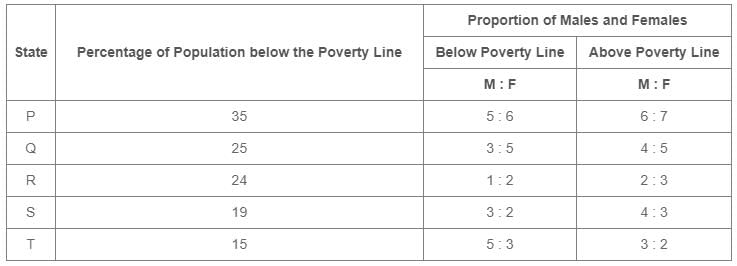
The following table gives the percentage distribution of population of five states, P, Q, R, S and T on the basis of poverty line and also on the basis of sex.

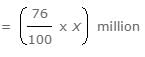
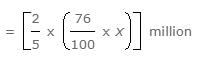
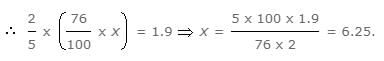
Q. If the male population above poverty line for State R is 1.9 million, then the total population of State R is?
Detailed Solution: Question 1
The following table gives the percentage distribution of population of five states, P, Q, R, S and T on the basis of poverty line and also on the basis of sex.

Q. What will be the male population above poverty line for State P if the female population below poverty line for State P is 2.1 million?
Detailed Solution: Question 2


The following table gives the percentage distribution of population of five states, P, Q, R, S and T on the basis of poverty line and also on the basis of sex.

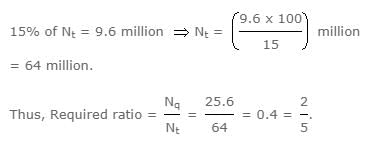
Q. If the population of males below poverty line for State Q is 2.4 million and that for State T is 6 million, then the total populations of States Q and T are in the ratio?
Detailed Solution: Question 3


The following table gives the percentage distribution of population of five states, P, Q, R, S and T on the basis of poverty line and also on the basis of sex.
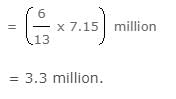
Q. What will be the number of females above the poverty line in the State S if it is known that the population of State S is 7 million?
Detailed Solution: Question 4
A school has four sections A, B, C, D of Class IX students.
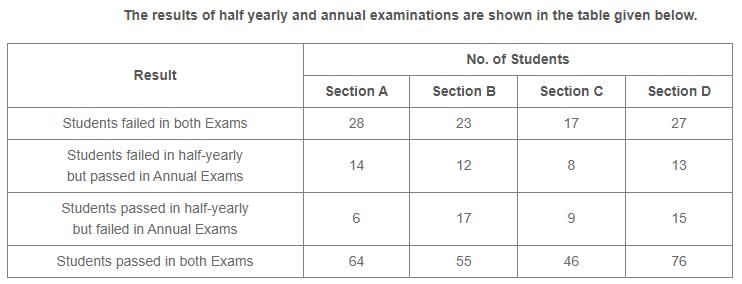
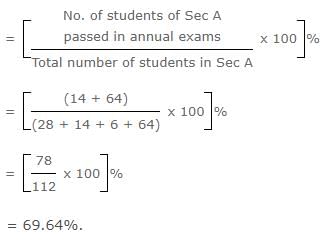
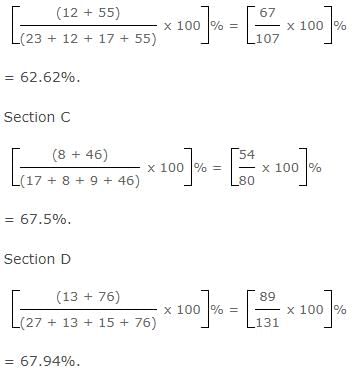
Q. Which section has the maximum success rate in annual examination?
Detailed Solution: Question 5
A school has four sections A, B, C, D of Class IX students.

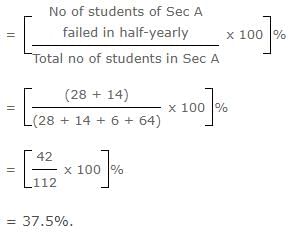
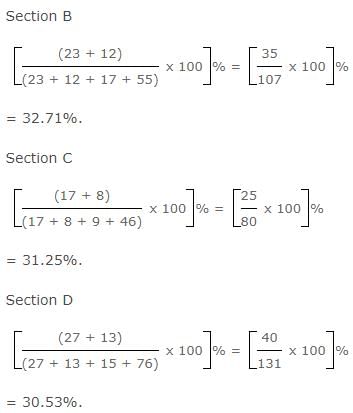
Q. Which section has the minimum failure rate in half yearly examination?
Detailed Solution: Question 6
A school has four sections A, B, C, D of Class IX students.

Q. How many students are there in Class IX in the school?
Detailed Solution: Question 7
A school has four sections A, B, C, D of Class IX students.

Q. If the number of students passing an examination be considered a criteria for comparison of difficulty level of two examinations, which of the following statements is true in this context?
Detailed Solution: Question 8
A school has four sections A, B, C, D of Class IX students.
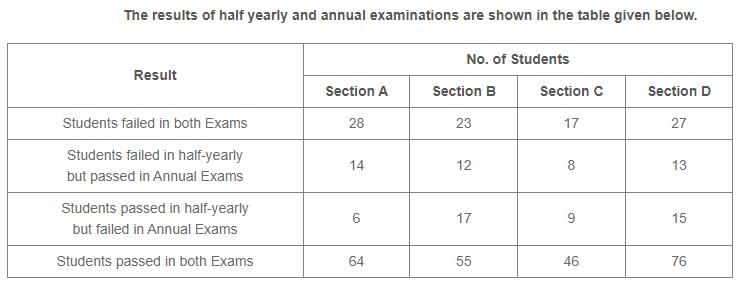
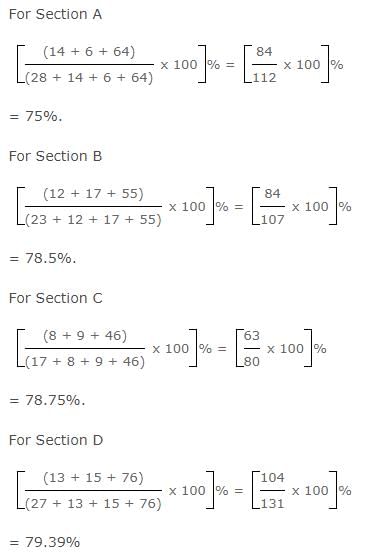
Q. Which section has the maximum pass percentage in at least one of the two examinations?
Detailed Solution: Question 9
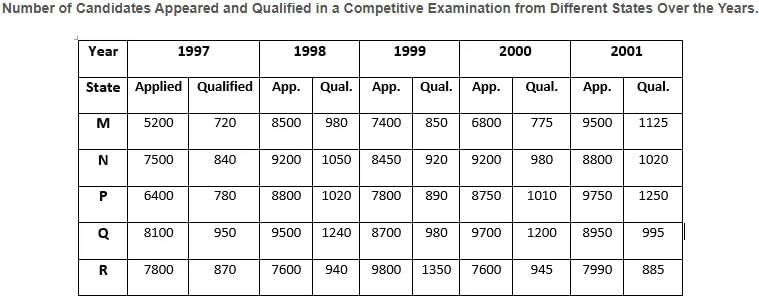
Study the following table and answer the questions.

Q. Total number of candidates qualified from all the states together in 1997 is approximately what percentage of the total number of candidates qualified from all the states together in 1998?
Detailed Solution: Question 10
Study the following table and answer the questions.

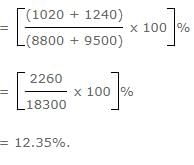
Q. The percentage of total number of qualified candidates to the total number of appeared candidates among all the five states in 1999 is?
Detailed Solution: Question 11
Study the following table and answer the questions.

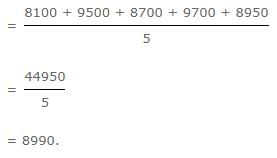
Q. What is the average candidates who appeared from State Q during the given years?
Detailed Solution: Question 12
Study the following table and answer the questions.

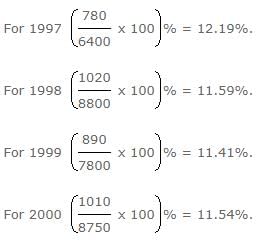
Q. In which of the given years the number of candidates appeared from State P has maximum percentage of qualified candidates?
Detailed Solution: Question 13
Study the following table and answer the questions.
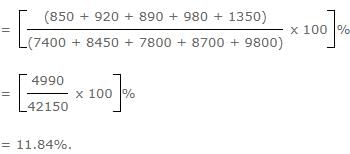
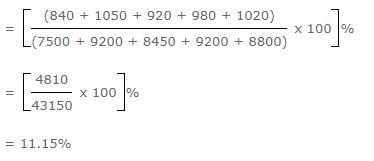
Q. What is the percentage of candidates qualified from State N for all the years together, over the candidates appeared from State N during all the years together?
Detailed Solution: Question 14
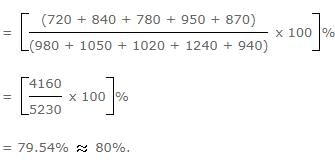
Study the following table and answer the questions.

Q. Combining the states P and Q together in 1998, what is the percentage of the candidates qualified to that of the candidate appeared?
Detailed Solution: Question 15
319 videos|366 docs|157 tests |