Bank Exams Exam  >  Bank Exams Tests  >  Data Interpretation for Competitive Examinations  >  MCQ Test: Bar Graphs - 1 - Bank Exams MCQ

MCQ Test: Bar Graphs - 1 - Bank Exams MCQ


Test Description

20 Questions MCQ Test Data Interpretation for Competitive Examinations - MCQ Test: Bar Graphs - 1

MCQ Test: Bar Graphs - 1 for Bank Exams 2024 is part of Data Interpretation for Competitive Examinations preparation. The MCQ Test: Bar Graphs - 1 questions and answers have been prepared according to the Bank Exams exam syllabus.The MCQ Test: Bar Graphs - 1 MCQs are made for Bank Exams 2024 Exam. Find important definitions, questions, notes, meanings, examples, exercises, MCQs and online tests for MCQ Test: Bar Graphs - 1 below.
Solutions of MCQ Test: Bar Graphs - 1 questions in English are available as part of our Data Interpretation for Competitive Examinations for Bank Exams & MCQ Test: Bar Graphs - 1 solutions in Hindi for Data Interpretation for Competitive Examinations course. Download more important topics, notes, lectures and mock test series for Bank Exams Exam by signing up for free. Attempt MCQ Test: Bar Graphs - 1 | 20 questions in 20 minutes | Mock test for Bank Exams preparation | Free important questions MCQ to study Data Interpretation for Competitive Examinations for Bank Exams Exam | Download free PDF with solutions
MCQ Test: Bar Graphs - 1 - Question 1

Directions: Study the following bar chart carefully and answer the questions given beside.
The number of people who visited four different places in two different years are given.

Q. What is difference between the sum of the number of people who visited Qutub Minar and India Gate in 2012 together and the sum of the number of people who visited Lotus Temple and India Gate in 2013 together?

Detailed Solution for MCQ Test: Bar Graphs - 1 - Question 1

The sum of the number of people who visited Qutub Minar and India Gate in 2012 together = (360 + 300) = 660
The sum of the number of people who visited Lotus Temple and India Gate in 2013 together = (420 + 240) = 660
 Difference = (660 – 660) = 0
Hence, option E is correct.

MCQ Test: Bar Graphs - 1 - Question 2

Directions: Study the following bar chart carefully and answer the questions given beside.
The number of people who visited four different places in two different years are given.

Q. What is the ratio of the number of people who visited Qutub Minar and India Gate in 2013 together and the number of people who visited Lotus Temple and Taj Mahal in 2012 together respectively?

Detailed Solution for MCQ Test: Bar Graphs - 1 - Question 2

The number of people who visited Qutub Minar and India Gate in 2013 together = (420 + 240) = 660
 The number of people who visited Lotus Temple and Taj Mahal in 2012 together = (320 +280) = 600
 Required ratio = 660 : 600 = 11 : 10
 Hence, option E is correct.

1 Crore+ students have signed up on EduRev. Have you? Download the App
MCQ Test: Bar Graphs - 1 - Question 3

Directions: Study the following bar chart carefully and answer the questions given beside.
The number of people who visited four different places in two different years are given.

Q. The number of people who visited Taj Mahal in 2013 is how much percent less than the number of people who visited Taj Mahal and Lotus Temple in 2012 together?

Detailed Solution for MCQ Test: Bar Graphs - 1 - Question 3

The number of people who visited Taj Mahal in 2013 = 450

The number of people who visited Taj Mahal and Lotus Temple in 2012 together = (280 + 320) = 600

Difference = (600 – 450) = 150

% less = 150/600 × 100 = 25%

Hence, option C is correct.

MCQ Test: Bar Graphs - 1 - Question 4

Directions: Study the following bar chart carefully and answer the questions given beside.
The number of people who visited four different places in two different years are given.

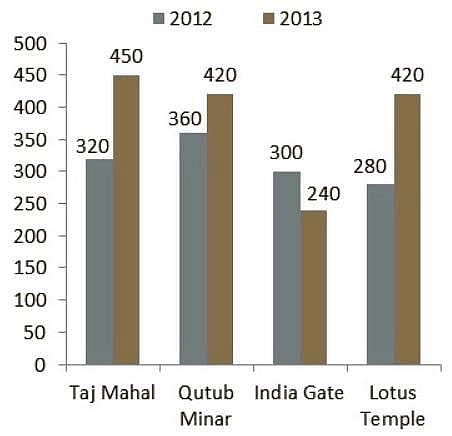
Q. Which place shows maximum percentage increase in number of people who visited from 2012 to 2013?

Detailed Solution for MCQ Test: Bar Graphs - 1 - Question 4

The difference between the number of people who visited Taj mahal in 2012 and 2013 = 450 – 320 = 130
% increased = 130/320 × 100 = 40.625%
The difference between the number of people who visited Qutub Minar in 2012 and 2013 = 420 – 360 = 60
% increased = 60/360 × 100 = 16.67%
The difference between the number of people who visited India Gate in 2012 and 2013 = 300 – 240 = 60
% decreased = 60-300 × 100 = 20%
The difference between the number of people who visited Lotus Temple in 2012 and 2013 = 420 – 280 = 140
% increased = 140/280 × 100 = 50%
Lotus Temple shows the maximum percentage increased in the number of people.
Hence, option B is correct.

MCQ Test: Bar Graphs - 1 - Question 5

Directions: Study the following bar chart carefully and answer the questions given beside.
The number of people who visited four different places in two different years are given.

Q. What is the average of the number of people who visited Taj Mahal in 2012, Qutub Minar in 2012, Lotus Temple in 2013 and India Gate in 2013?

Detailed Solution for MCQ Test: Bar Graphs - 1 - Question 5

Sum of the number of people who visited Taj Mahal in 2012, Qutub Minar in 2012, Lotus Temple in 2013 and India Gate in 2013 = (320 + 360 + 420 + 240) = 1340

Reqd. average = 1340/4 = 335

Hence, option A is correct.

MCQ Test: Bar Graphs - 1 - Question 6

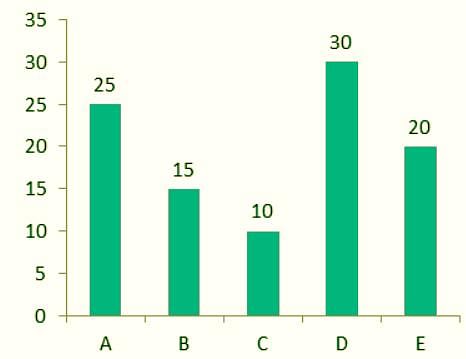
In a factory, there are 39 workers who have been categorized into five groups (A, B, C, D, E) on the basis of the range of their daily wages (in multiples of Rs.100). It is ensured that the daily wage of no worker is an exact multiple of Rs.100. The distribution is presented through the given histogram.

If two Managers are engaged to supervise the workers, with daily wages ranging between Rs.700 and Rs.800, then what will be the average daily wage (nearest to an Rs.) of all members of staff of the factory?

Detailed Solution for MCQ Test: Bar Graphs - 1 - Question 6

Calculation:

There will be a total of 41 members in the factory = 39 workers + 2 managers

Daily wages of the managers ranges between 700 and 800, it would be calculated on the basis of 750.

Similarly, the calculation would be done according to the midpoints (for eg. if 5  employees have their salaries between 200 to 300, it will be solved as 5 × 250)

Total daily wages of all members of staff of the factory = 250 × 5 + 350 × 9 + 450 × 12 + 550 × 11 + 650 × 2 + 750 × 2 = Rs.18650

Total number of workers = 5 + 9 + 12 + 11 + 2 + 2 = 41

∴ the average daily wage of all members of staff of the factory = 18650/41 = 454.8 ≈ Rs.455

MCQ Test: Bar Graphs - 1 - Question 7

Direction: Study the graph and answer the following questions :

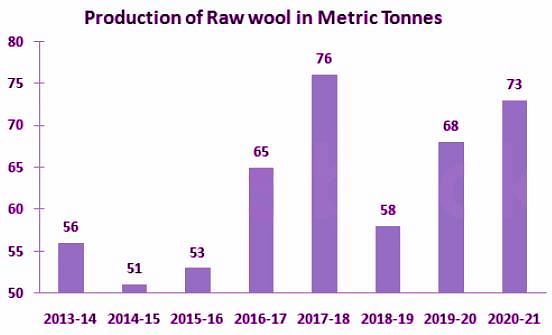
The production of raw wool in 2014-15 was _______ of the production in 2019-20.

Detailed Solution for MCQ Test: Bar Graphs - 1 - Question 7

Calculation:

Production of raw wool in 2014-15 = 51

Production of raw wool in 2019-20 = 68

Required production of raw wool = (51/68)

⇒ 3/4

∴ Required production of raw wool is 3/4

MCQ Test: Bar Graphs - 1 - Question 8

The given bar chart represents the number of Televisions Sets (TV) manufactured (in thousands) and the respective percentage of those TV Sets sold by five different companies A, B, C, D and E in 2015.

Study the chart carefully and answer the question that follows.

The average number of TV sets sold by companies C and D is what percentage of the number of TV sets manufactured by company E? Express your answer correct to one place of decimal.

Detailed Solution for MCQ Test: Bar Graphs - 1 - Question 8

Calculation:

TV sets manufactured by company C = 70000

TV sets sold by company C = 82% of 70000 = 57400

TV sets manufactured by company D = 85000

TV sets sold by company D = 56% of 85000 = 47600

Total TV sold by C and D = 57400 + 47600 = 105000

Average TV sold by C and D = 105000/2 = 52500

TV sets manufactured by company E = 58000

Now, % = 52500/58000 × 100% ≈ 90.5%

∴ The average number of TV sets sold by companies C and D is 90.5% of the number of TV sets manufactured by company E.

MCQ Test: Bar Graphs - 1 - Question 9

The given histogram shows the heights of 232 students of an athletic club and their numbers.

Study the histogram carefully and answer the questions that follows.

Q. If the histogram is to be presented by a line diagram, what would be the starting point and the end point of the line diagram?

Detailed Solution for MCQ Test: Bar Graphs - 1 - Question 9

Given:-

Athletic club of 232 members and their height's frequency.

Concept used:-

Frequency Polygon:-  A frequency polygon is a graph constructed by using lines to join the midpoints of each interval or bin. The heights of the points represent the frequencies. A frequency polygon can be created from the histogram or by calculating the midpoints of the bins from the frequency distribution table.

Formula Used:

Class size = Upper limit - Lower limit

Calculation:

From histogram -

Class size = Upper limit - Lower limit

Class size = 125 - 120 = 5

∴ Mid point of a class = 5/2 = 2.5

So, Starting point of Line graph -

X - co-ordinate = 120 - 2.5 = 117.5

Y - co-ordinate = frequency of point = 0

∴ Starting point = (117.5,0)

End point of Line graph -

X - co-ordinate = 170 + 2.5 = 172.5

Y - co-ordinate = frequency of point =  0

∴ End point = (172.5,0)

∴ Required points are (117.5,0) and (172.5,0).

MCQ Test: Bar Graphs - 1 - Question 10

The following bar graph shows the total number of employees in 4 different companies.
What is the sum of female employees of company Q and company S?

Detailed Solution for MCQ Test: Bar Graphs - 1 - Question 10

Calculation:

Female in Q = 1240 - 350 = 890

Female in S = 825 - 340 = 485

According to the question:

Sum = 890 + 485 = 1375

∴ Option 3 is the correct answer.

MCQ Test: Bar Graphs - 1 - Question 11

Directions: Study the following bar chart carefully and answer the questions given beside.
The following graph shows the percentage break-up of sales of units of different products in 2018.

Product A is sold at Rs.40/unit. The shopkeeper earns Rs.18000 from product A.

Q. How many units of product A were sold ?

Detailed Solution for MCQ Test: Bar Graphs - 1 - Question 11

The reqd. answer is = 18000/40 = 450
Hence, option B is correct.

MCQ Test: Bar Graphs - 1 - Question 12

Directions: Study the following bar chart carefully and answer the questions given beside.
The following graph shows the percentage break-up of sales of units of different products in 2018.

The product A is sold at Rs.40/unit. The shopkeeper earns Rs.18000 from product A.

Q. Due to mishandling 35% of the units of product D were damaged. The remaining units of product D were sold at Rs. 30/unit and the damaged ones were sold at Rs. 12/unit and the cost price of each unit of product D was Rs. 25. What was the loss that the shopkeeper incurred?

Detailed Solution for MCQ Test: Bar Graphs - 1 - Question 12

Number of units of product D = 30/25 × 450 = 540

Total Cost price = Rs. 25 × 540 = Rs. 13500

35% units of product D were damaged and sold at Rs.12/unit ,

So total SP of damaged products = 35% of 540 × 12 = Rs. 2268

Total SP of remaining products of D = 65% of 540 × 30 = Rs. 10530

Total loss = Rs. (13500 – 2268 – 10530) = Rs. 702

Hence option A is correct.

MCQ Test: Bar Graphs - 1 - Question 13

Directions: Study the following bar chart carefully and answer the questions given beside.
The following graph shows the percentage break-up of sales of units of different products in 2018.

The product A is sold at Rs.40/unit. The shopkeeper earns Rs.18000 from product A.

Q. The shopkeeper bought the units of product C at a total of Rs. 8100. What should be the selling price per unit of the product so that he can make a profit of 20%?

Detailed Solution for MCQ Test: Bar Graphs - 1 - Question 13

Number of units of product C = 10/25 × 450 = 180

The cost price of product C per unit
= 8100/180 = Rs.45

The selling price to gain a 20% profit

= 120/100 × 45 = Rs.54/unit

Hence, Option B is correct.

MCQ Test: Bar Graphs - 1 - Question 14

Directions: Study the following bar chart carefully and answer the questions given beside.
The following graph shows the percentage break-up of sales of units of different products in 2018.

Product A is sold at Rs.40/unit. The shopkeeper earns Rs.18000 from product A.

Q. The shopkeeper made Rs. 25 profit on each unit of product B. How much profit did the shopkeeper make?

Detailed Solution for MCQ Test: Bar Graphs - 1 - Question 14

No. of units of product A sold = 18000/40 = 450
So total products sold = 

No. of units of products B sold = 

The profit made = (270 × 25) = Rs. 6750

Hence, option A is correct.

MCQ Test: Bar Graphs - 1 - Question 15

Directions: Study the following bar chart carefully and answer the questions given beside.
The following graph shows the percentage break-up of sales of units of different products in 2018.

Product A is sold at Rs.40/unit. The shopkeeper earns Rs.18000 from product A.

Detailed Solution for MCQ Test: Bar Graphs - 1 - Question 15

The required ratio is = 25 : 20 = 5 : 4
Hence, Option D is correct.

MCQ Test: Bar Graphs - 1 - Question 16

Directions : Study the following bar chart carefully and answer the questions given below:
Given line graph shows the data of washing machines of different price range of various brands during Diwali festival.

Q. Total sale of Samsung is what percentage more / less than total sale of Whirlpool?

Detailed Solution for MCQ Test: Bar Graphs - 1 - Question 16

Total sale of Samsung = 500 + 350 = 850

Total sale of Whirlpool = 320 + 270 = 590


Hence, option C is the correct answer.

MCQ Test: Bar Graphs - 1 - Question 17

Directions : Study the following bar chart carefully and answer the questions given below:
Given line graph shows the data of washing machines of different price range of various brands during Diwali festival.

Q. What is the difference between average numbers of machines sold by Samsung, Godrej and Videocon of price more than Rs. 10000 and average number of machines sold by LG and Whirlpool of price up to Rs. 10000?

Detailed Solution for MCQ Test: Bar Graphs - 1 - Question 17

Machines sold by Samsung, Godrej and Videocon of price more than Rs. 10000 = 350 + 180 + 230 = 760

Average = 760/3 = 253.3

Machines sold by LG and Whirlpool of price up to Rs. 10000

= 450 + 320 = 770

Average = 770/2 = 385

Required difference = 385 – 253.3 = 131.7

Hence, option E is the correct answer.

MCQ Test: Bar Graphs - 1 - Question 18

Directions : Study the following bar chart carefully and answer the questions given below:
Given line graph shows the data of washing machines of different price range of various brands during Diwali festival.

Q. How many washing machines of price up to Rs. 10000 were sold in the festival?

Detailed Solution for MCQ Test: Bar Graphs - 1 - Question 18

Washing machines of price up to Rs. 10000
 that were sold in the festival = 500 + 450 + 250 + 320 + 220 = 1740
 Hence, option B is the correct answer.

MCQ Test: Bar Graphs - 1 - Question 19

Directions : Study the following bar chart carefully and answer the questions given below:
Given line graph shows the data of washing machines of different price range of various brands during Diwali festival.

Q. What is the ratio of total washing machines sold by LG and Godrej together of price up to Rs. 10000 to total washing machines sold by Videocon and Whirlpool together of price more than Rs. 10000?

Detailed Solution for MCQ Test: Bar Graphs - 1 - Question 19

Total machines sold by LG and Godrej together of price upto Rs. 10000 = 450 + 250 = 700

Total machines sold by Videocon and Whirlpool together of price more than Rs. 10000 = 230 + 270 = 500

Reqd. ratio = 700/500 = 7 : 5

Hence, option A is the correct answer.

MCQ Test: Bar Graphs - 1 - Question 20

Directions : Study the following bar chart carefully and answer the questions given below:
Given line graph shows the data of washing machines of different price range of various brands during Diwali festival.

Q. Which brand sold maximum number of machines?

Detailed Solution for MCQ Test: Bar Graphs - 1 - Question 20

Samsung machines sold = 500 + 350 = 850
 LG machines sold = 450 + 400 = 850
 Whirlpool machines sold = 320 + 270 = 590
 Godrej machines sold = 250 + 180 = 430
 Samsung and LG sold same number of machines.
 Hence, option E is the correct answer.

17 videos|9 docs|42 tests
Information about MCQ Test: Bar Graphs - 1 Page
In this test you can find the Exam questions for MCQ Test: Bar Graphs - 1 solved & explained in the simplest way possible. Besides giving Questions and answers for MCQ Test: Bar Graphs - 1, EduRev gives you an ample number of Online tests for practice

Top Courses for Bank Exams

Download as PDF

Top Courses for Bank Exams