Class 9 Exam  >  Class 9 Tests  >  Science Class 9  >  MCQ: Velocity-Time Graphs - Class 9 MCQ

MCQ: Velocity-Time Graphs - Class 9 MCQ


Test Description

10 Questions MCQ Test Science Class 9 - MCQ: Velocity-Time Graphs

MCQ: Velocity-Time Graphs for Class 9 2024 is part of Science Class 9 preparation. The MCQ: Velocity-Time Graphs questions and answers have been prepared according to the Class 9 exam syllabus.The MCQ: Velocity-Time Graphs MCQs are made for Class 9 2024 Exam. Find important definitions, questions, notes, meanings, examples, exercises, MCQs and online tests for MCQ: Velocity-Time Graphs below.
Solutions of MCQ: Velocity-Time Graphs questions in English are available as part of our Science Class 9 for Class 9 & MCQ: Velocity-Time Graphs solutions in Hindi for Science Class 9 course. Download more important topics, notes, lectures and mock test series for Class 9 Exam by signing up for free. Attempt MCQ: Velocity-Time Graphs | 10 questions in 10 minutes | Mock test for Class 9 preparation | Free important questions MCQ to study Science Class 9 for Class 9 Exam | Download free PDF with solutions
MCQ: Velocity-Time Graphs - Question 1

The area enclosed by velocity-time graph and the time axis will be equal to the magnitude of

Detailed Solution for MCQ: Velocity-Time Graphs - Question 1

  • The area under the velocity-time graph represents the total change in position over time.
  • This area can be positive or negative, indicating direction, hence it measures displacement.
  • Displacement is the net change in position, while distance measures the total path traveled.
  • Speed is the magnitude of velocity, and acceleration measures the change in velocity over time.
  • Thus, the correct answer is displacement as represented by the area under the graph.

Topic in NCERT: Velocity-Time Graphs

Line in NCERT: "The area enclosed by velocity-time graph and the time axis will be equal to the magnitude of the displacement."

MCQ: Velocity-Time Graphs - Question 2

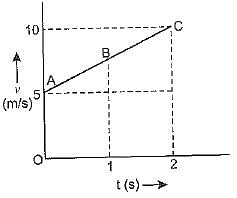
The velocity time graph of a moving particle is shown in Figure, The acceleration of the particle is
Detailed Solution for MCQ: Velocity-Time Graphs - Question 2

Velocity-Time Graph Analysis:
- The slope of the velocity-time graph gives the acceleration of the particle.
- If the velocity-time graph is a straight line, the acceleration is constant.
- The acceleration can be calculated by finding the slope of the line.
Calculating Acceleration:
- The acceleration can be calculated using the formula: acceleration = change in velocity / change in time.
- By looking at the graph, we can see that the change in velocity is 10 m/s and the change in time is 4 seconds.
Acceleration Calculation:
- acceleration = change in velocity/ time
- acceleration = 10-5 / 2 = 2.5 m/s2
Therefore, the acceleration of the particle is 2.5 m/s2. Hence, the correct answer is option D: 2.5 m/s2

1 Crore+ students have signed up on EduRev. Have you? Download the App
MCQ: Velocity-Time Graphs - Question 3

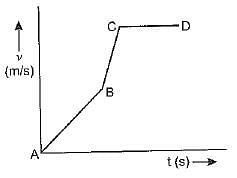
The velocity time (v - t) graph of a moving particle is shown in Figure. The acceleration is maximum for segment
Detailed Solution for MCQ: Velocity-Time Graphs - Question 3

Option B is correct .

The maximum acceleration occurs during segment B to C as it has the steepest slope on the graph, representing the highest rate of change of velocity.

Topic in NCERT: Velocity-Time Graphs and Distance Calculation

Line in NCERT: "Since the magnitude of the velocity of the car is changing due to acceleration, the distance s travelled by the car will be given by the area ABCDE under the velocity-time graph."

MCQ: Velocity-Time Graphs - Question 4

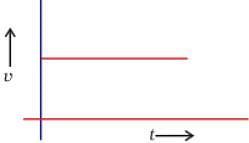
From the given v - t graph, it can be inferred that the object is
Detailed Solution for MCQ: Velocity-Time Graphs - Question 4

In the given graph we find that the velocity is constant throughout, hence the object represented in the v - t graph is said to be in uniform motion.  Zero acceleration is also called uniform acceleration.

MCQ: Velocity-Time Graphs - Question 5

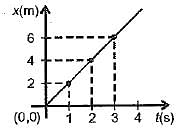
The slope of the x - t graph is a measure of

Detailed Solution for MCQ: Velocity-Time Graphs - Question 5

v = (6 - 0) m / (3 - 0) s = 2 m/s

MCQ: Velocity-Time Graphs - Question 6

If the velocity of a body is reducing, it is said to have

Detailed Solution for MCQ: Velocity-Time Graphs - Question 6

The correct answer is D: Both (a) and (b).

  • Acceleration is the rate of change of velocity. It can be positive (increasing velocity) or negative (decreasing velocity).
  • Retardation is another term specifically used for negative acceleration. It describes a situation where the velocity is slowing down.

Therefore, when the velocity of a body is reducing, it has both:

  • Negative acceleration: Because the change in velocity is negative.
  • Retardation: Because it's the specific term for negative acceleration in the context of slowing down.

Topic in NCERT: Acceleration

Line in NCERT: "the acceleration is taken to be positive if it is in the direction of velocity and negative when it is opposite to the"

MCQ: Velocity-Time Graphs - Question 7

In a velocity-time graph, which variable is plotted on the Y-axis?

Detailed Solution for MCQ: Velocity-Time Graphs - Question 7

- In a velocity-time graph:
- The Y-axis represents Velocity.
- The X-axis represents Time.
- Thus, the variable plotted on the Y-axis is Velocity.

MCQ: Velocity-Time Graphs - Question 8

The area under a velocity-time graph is represented by the unit:

Detailed Solution for MCQ: Velocity-Time Graphs - Question 8

The area under the velocity-time graph gives the distance (magnitude of displacement) which has the unit: metre (m)

Topic in NCERT: VELOCITY-TIME GRAPHS

Line in NCERT: "The area under the velocity-time graph gives the distance (magnitude of displacement) moved by the car in a given interval of time."

MCQ: Velocity-Time Graphs - Question 9

Slope of a velocity-time graph gives

Detailed Solution for MCQ: Velocity-Time Graphs - Question 9

The correct answer is C: the acceleration.

  • A velocity-time graph shows how velocity changes over time.
  • The slope of this graph represents the rate of change of velocity, which is acceleration.
  • If the slope is positive, the object is accelerating; if negative, it's decelerating.
  • Slope is calculated as the change in velocity divided by the change in time.
  • Thus, a steeper slope indicates a greater acceleration.
MCQ: Velocity-Time Graphs - Question 10

The area under the velocity-time graph gives the value of ......... .

Detailed Solution for MCQ: Velocity-Time Graphs - Question 10

- The area under the velocity-time graph represents displacement.
- In physics, displacement is the change in position of an object and is a vector quantity.
- The graph's area considers both magnitude and direction, reflecting total displacement.
- If velocity is constant, displacement is simply velocity multiplied by time.
- Positive and negative areas (above and below the time axis) indicate direction changes in motion.
- Therefore, the correct answer is B: displacement.

88 videos|369 docs|67 tests
Information about MCQ: Velocity-Time Graphs Page
In this test you can find the Exam questions for MCQ: Velocity-Time Graphs solved & explained in the simplest way possible. Besides giving Questions and answers for MCQ: Velocity-Time Graphs, EduRev gives you an ample number of Online tests for practice

Top Courses for Class 9

88 videos|369 docs|67 tests
Download as PDF

Top Courses for Class 9