Math Olympiad Test: Statistics- 2 - Free MCQ with solutions Class 9 Mathematics
MCQ Practice Test & Solutions: Math Olympiad Test: Statistics- 2 (15 Questions)
You can prepare effectively for Class 9 Mathematics Olympiad for Class 9 with this dedicated MCQ Practice Test (available with solutions) on the important topic of " Math Olympiad Test: Statistics- 2". These 15 questions have been designed by the experts with the latest curriculum of Class 9 2026, to help you master the concept.
Test Highlights:
- - Format: Multiple Choice Questions (MCQ)
- - Duration: 15 minutes
- - Number of Questions: 15
Sign up on EduRev for free to attempt this test and track your preparation progress.

The no. of class intervals, if the magnitude of class interval is 4 will be:
Data: 31, 23, 19, 29, 20, 16, 22, 10, 13, 34, 33, 38, 36, 24, 18, 15, 12, 30, 27, 23, 20
Data: 31, 23, 19, 29, 20, 16, 22, 10, 13, 34, 33, 38, 36, 24, 18, 15, 12, 30, 27, 23, 20
Detailed Solution: Question 1
The class marks of a distribution are:
52, 47, 57, 67, 62, 72, 82, 87, 97, 92, 102.
Q. The lower and upper limits of first class interval will be:
52, 47, 57, 67, 62, 72, 82, 87, 97, 92, 102.
Q. The lower and upper limits of first class interval will be:
Detailed Solution: Question 2

Detailed Solution: Question 3
 .
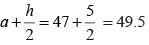
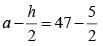
.The mid–value and upper limit of a class interval are 41 and 47 respectively. The class size will be:
Detailed Solution: Question 4


Detailed Solution: Question 5
In the ‘more–than’ type of ogive the cumulative frequency is plotted against:
Detailed Solution: Question 6
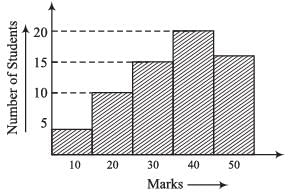
The frequency of students is highest in the class interval:
Detailed Solution: Question 7
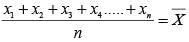
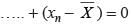
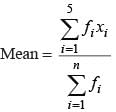
The mean of x1, x2, ……., xn is  , then the value of:
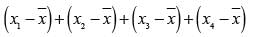
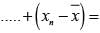
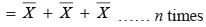
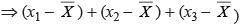
, then the value of:Detailed Solution: Question 8

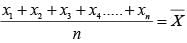
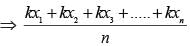
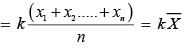
If each number in (Prob - 17) is multiplied by k, the new mean will be:
Detailed Solution: Question 9
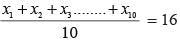
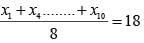
The mean of 10 numbers is 16. If two consecutive numbers are excluded, the new mean is 18. The sum of the excluded numbers is:
Detailed Solution: Question 10
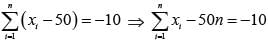
The sum of deviations of a set of n values x1, x2, …… xn measured from 50 is – 10 and the sum of deviations of the values from 46 is 70. The value of n is:
Detailed Solution: Question 11
 …(i)
…(i)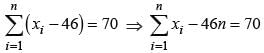 …(ii)
…(ii)
Detailed Solution: Question 12
Detailed Solution: Question 13
The new median, of the following data, if 37 is replaced by 5.
7, 9, 16, 25, 31, 36, 37, 39, 40, 42, 43
7, 9, 16, 25, 31, 36, 37, 39, 40, 42, 43
Detailed Solution: Question 14
 = 6th number will be the median.
 The mode of the following data is:
29, 40, 41, 46, 45, 44, 43, 29, 40, 41, 46, 44, 44, 47, 49, 53, 29, 57, 44, 43, 41, 28, 16, 26.
29, 40, 41, 46, 45, 44, 43, 29, 40, 41, 46, 44, 44, 47, 49, 53, 29, 57, 44, 43, 41, 28, 16, 26.
Detailed Solution: Question 15
23 videos|105 docs|45 tests |