Test: ACT Chemistry Data Representation Questions - ACT MCQ
10 Questions MCQ Test Science for ACT - Test: ACT Chemistry Data Representation Questions
The rate of a reversible chemical reaction depends on many factors, including concentrations of the reactants and products, temperature, and presence of enzymes called catalysts. In the forward reaction, two reactants combine to form one product. However, in a reverse reaction, the product is broken down into the two reactants.
In order for a forward reaction to occur, the reactants moving around in the test tube must physically interact with each other. The more often reactants interact with each other, the more produce is formed in the same amount of time. The speed at which reactants combine into products (the rate of the reaction) can be calculated by dividing the amount of a chemical produced in a reaction (often measured in moles) by the time it takes to produce that amount.
In order to determine the effects of reactant and product concentration, temperature, and presence of catalysts on the rate of a reaction, a scientist studied the following reaction:

The scientist varied the conditions of the experiment and measured the rate of the reaction. The results are outlined in Table 1. The units of concentration are moles per liter.

Q. If the moles of acid convertase were doubled, how would the rate of reaction change?


The rate of a reversible chemical reaction depends on many factors, including concentrations of the reactants and products, temperature, and presence of enzymes called catalysts. In the forward reaction, two reactants combine to form one product. However, in a reverse reaction, the product is broken down into the two reactants.
In order for a forward reaction to occur, the reactants moving around in the test tube must physically interact with each other. The more often reactants interact with each other, the more produce is formed in the same amount of time. The speed at which reactants combine into products (the rate of the reaction) can be calculated by dividing the amount of a chemical produced in a reaction (often measured in moles) by the time it takes to produce that amount.
In order to determine the effects of reactant and product concentration, temperature, and presence of catalysts on the rate of a reaction, a scientist studied the following reaction:

The scientist varied the conditions of the experiment and measured the rate of the reaction. The results are outlined in Table 1. The units of concentration are moles per liter.

Q. What is a possible unit of a rate of reaction?


| 1 Crore+ students have signed up on EduRev. Have you? Download the App |
Chemists can model how solids, liquids, and gases behave at different temperatures and pressures with a graph called a phase diagram. When the pressure and temperature are simultaneously known, a scientist can predict whether the material will be in a specific state. The diagram is divided into sections depending on the phase and the lines between sections represent phase transitions occurring between two or more separate phases.
In general, solids of neatly stacked molecules exist when temperatures are low and pressures are intermediate. These values decrease the kinetic energy of the molecules enough to allow for attractive forces to begin the stacking process. Liquids, by contrast, are found at intermediate pressures and temperatures. The temperature is high enough to impart enough kinetic energy to prevent solid formation and the pressure is high enough to prevent the liquid from becoming a gas. Finally, a gas forms at low pressures and high temperatures. The high level of kinetic energy prevents molecules from associating with one another.
Materials can undergo processes called phase transitions, meaning they can transition from one phase to another. The transition from a solid to a liquid is called melting, while the reverse transition is called freezing. Vaporization occurs when a liquid becomes a gas, while condensation occurs when a gas becomes a liquid. Finally, in a process called sublimation, a solid can directly become a gas without passing through a liquid phase. Additionally, when a gas directly becomes a solid, this is known as deposition.
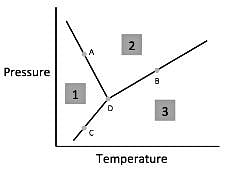
Q. According to the figure, the material represented by Area 1 is in what phase?

Chemists can model how solids, liquids, and gases behave at different temperatures and pressures with a graph called a phase diagram. When the pressure and temperature are simultaneously known, a scientist can predict whether the material will be in a specific state. The diagram is divided into sections depending on the phase and the lines between sections represent phase transitions occurring between two or more separate phases.
In general, solids of neatly stacked molecules exist when temperatures are low and pressures are intermediate. These values decrease the kinetic energy of the molecules enough to allow for attractive forces to begin the stacking process. Liquids, by contrast, are found at intermediate pressures and temperatures. The temperature is high enough to impart enough kinetic energy to prevent solid formation and the pressure is high enough to prevent the liquid from becoming a gas. Finally, a gas forms at low pressures and high temperatures. The high level of kinetic energy prevents molecules from associating with one another.
Materials can undergo processes called phase transitions, meaning they can transition from one phase to another. The transition from a solid to a liquid is called melting, while the reverse transition is called freezing. Vaporization occurs when a liquid becomes a gas, while condensation occurs when a gas becomes a liquid. Finally, in a process called sublimation, a solid can directly become a gas without passing through a liquid phase. Additionally, when a gas directly becomes a solid, this is known as deposition.
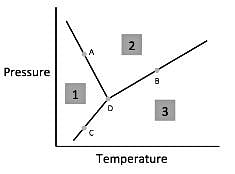
Q. According to the figure, the material represented by area two is in what phase?
Chemists can model how solids, liquids, and gases behave at different temperatures and pressures with a graph called a phase diagram. When the pressure and temperature are simultaneously known, a scientist can predict whether the material will be in a specific state. The diagram is divided into sections depending on the phase and the lines between sections represent phase transitions occurring between two or more separate phases.
In general, solids of neatly stacked molecules exist when temperatures are low and pressures are intermediate. These values decrease the kinetic energy of the molecules enough to allow for attractive forces to begin the stacking process. Liquids, by contrast, are found at intermediate pressures and temperatures. The temperature is high enough to impart enough kinetic energy to prevent solid formation and the pressure is high enough to prevent the liquid from becoming a gas. Finally, a gas forms at low pressures and high temperatures. The high level of kinetic energy prevents molecules from associating with one another.
Materials can undergo processes called phase transitions, meaning they can transition from one phase to another. The transition from a solid to a liquid is called melting, while the reverse transition is called freezing. Vaporization occurs when a liquid becomes a gas, while condensation occurs when a gas becomes a liquid. Finally, in a process called sublimation, a solid can directly become a gas without passing through a liquid phase. Additionally, when a gas directly becomes a solid, this is known as deposition.
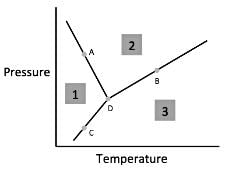
Q. According to the figure, the material represented by area three is in what phase?
The Ideal Gas Law is as follows:
PV=nRT
P is pressure as measured in Pascals, V is volume as measured in cubic meters, n is the number of moles of the gas, R is the gas constant known as 8.314 Joules per mole times Kelvin, and T is the temperature measured in Kelvin.
A class of students began studying the Ideal Gas Law and how the Pressure and the Volume relate to one another. They took 20 moles of a sample gas and kept the room at a temperature of 300 Kelvin. They then used different sized containers of the gas to limit and expand the volume. At each different volume, they measure the pressure of the gas on its container. The table they made from their results is seen in table 1.
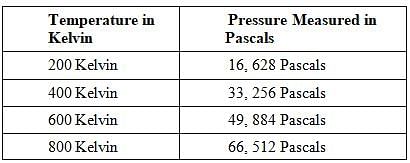
TABLE 1
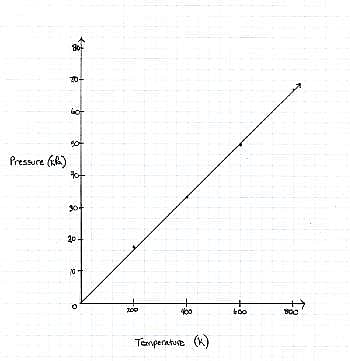
FIGURE 1
The graph the students made based on the data is seen in Figure 1.
Pressure is created by the movement of the gas molecules pushing against a container. 0 Kelvin is known as absolute 0, the temperature at which all molecule movement theoretically stops.
Q. Describe the relationship between the temperature and the pressure.
Current high levels of fossil fuel use, including coal-burning power plants and gasoline-powered automobiles, have helped contribute to the high concentrations of sulfur trioxide, SO3, found in the atmosphere. When sulfur trioxide and water interact, they can undergo the following chemical reaction to produce sulfuric acid, which is the main contributor to acid rain worldwide:
SO3 + H2O ⇌ H2SO4
Acid rain showers are particularly common near coal-burning power plants and large cities. These showers are responsible for significant economic damage to sidewalks, roads, and buildings. Scientists interested in studying the effects of acid rain often use basic substances like calcium carbonate, the main component of limestone buildings, and expose them to varying volumes of acid rain to determine what volume of acid rain is necessary to begin to erode a building. A sample graph of one scientist’s experiment is replicated below:
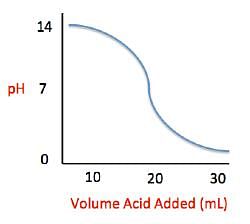
Measuring acid and base levels is commonly done with a scale called pH, which uses the concentration of hydrogen ions to determine the acidity. Hydrogen ions are in a balance with hydroxide ions to give a scale with a range from 0 to 14. Values equal to or between 0 and 6.9 represent the acidic range where hydrogen ions predominate and values equal to or ranging from 7.1 and 14 represent the basic range where hydroxide ions predominate. Thus, the more hydrogen ions present, the more acidic the solution.
Scientists can tell when a titration (pH) experiment passes a certain pH using compounds called indicators. Indicators are usually colorless at pH levels below that of their specified color change. A table of indicators used by the above scientists and the pH at which they change colors is presented below.

Q. What is the pH of a solution containing calcium carbonate and sulfuric acid when 20 mL of sulfuric acid have been added?
Current high levels of fossil fuel use, including coal-burning power plants and gasoline-powered automobiles, have helped contribute to the high concentrations of sulfur trioxide, SO3, found in the atmosphere. When sulfur trioxide and water interact, they can undergo the following chemical reaction to produce sulfuric acid, which is the main contributor to acid rain worldwide:
SO3 + H2O ⇌ H2SO4
Acid rain showers are particularly common near coal-burning power plants and large cities. These showers are responsible for significant economic damage to sidewalks, roads, and buildings. Scientists interested in studying the effects of acid rain often use basic substances like calcium carbonate, the main component of limestone buildings, and expose them to varying volumes of acid rain to determine what volume of acid rain is necessary to begin to erode a building. A sample graph of one scientist’s experiment is replicated below:
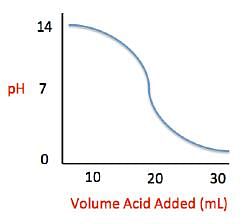
Measuring acid and base levels is commonly done with a scale called pH, which uses the concentration of hydrogen ions to determine the acidity. Hydrogen ions are in a balance with hydroxide ions to give a scale with a range from 0 to 14. Values equal to or between 0 and 6.9 represent the acidic range where hydrogen ions predominate and values equal to or ranging from 7.1 and 14 represent the basic range where hydroxide ions predominate. Thus, the more hydrogen ions present, the more acidic the solution.
Scientists can tell when a titration (pH) experiment passes a certain pH using compounds called indicators. Indicators are usually colorless at pH levels below that of their specified color change. A table of indicators used by the above scientists and the pH at which they change colors is presented below.

Q. What is the pH of a solution containing calcium carbonate and sulfuric acid when 29 mL of sulfuric acid have been added?
Current high levels of fossil fuel use, including coal-burning power plants and gasoline-powered automobiles, have helped contribute to the high concentrations of sulfur trioxide, SO3, found in the atmosphere. When sulfur trioxide and water interact, they can undergo the following chemical reaction to produce sulfuric acid, which is the main contributor to acid rain worldwide:
SO3 + H2O ⇌ H2SO4
Acid rain showers are particularly common near coal-burning power plants and large cities. These showers are responsible for significant economic damage to sidewalks, roads, and buildings. Scientists interested in studying the effects of acid rain often use basic substances like calcium carbonate, the main component of limestone buildings, and expose them to varying volumes of acid rain to determine what volume of acid rain is necessary to begin to erode a building. A sample graph of one scientist’s experiment is replicated below:
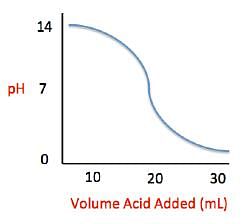
Measuring acid and base levels is commonly done with a scale called pH, which uses the concentration of hydrogen ions to determine the acidity. Hydrogen ions are in a balance with hydroxide ions to give a scale with a range from 0 to 14. Values equal to or between 0 and 6.9 represent the acidic range where hydrogen ions predominate and values equal to or ranging from 7.1 and 14 represent the basic range where hydroxide ions predominate. Thus, the more hydrogen ions present, the more acidic the solution.
Scientists can tell when a titration (pH) experiment passes a certain pH using compounds called indicators. Indicators are usually colorless at pH levels below that of their specified color change. A table of indicators used by the above scientists and the pH at which they change colors is presented below.

Q. The relationship between pH and volume of acid added can best be described as which of the following?
Current high levels of fossil fuel use, including coal-burning power plants and gasoline-powered automobiles, have helped contribute to the high concentrations of sulfur trioxide, SO3, found in the atmosphere. When sulfur trioxide and water interact, they can undergo the following chemical reaction to produce sulfuric acid, which is the main contributor to acid rain worldwide:
SO3 + H2O ⇌ H2SO4
Acid rain showers are particularly common near coal-burning power plants and large cities. These showers are responsible for significant economic damage to sidewalks, roads, and buildings. Scientists interested in studying the effects of acid rain often use basic substances like calcium carbonate, the main component of limestone buildings, and expose them to varying volumes of acid rain to determine what volume of acid rain is necessary to begin to erode a building. A sample graph of one scientist’s experiment is replicated below:
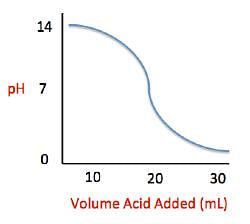
Measuring acid and base levels is commonly done with a scale called pH, which uses the concentration of hydrogen ions to determine the acidity. Hydrogen ions are in a balance with hydroxide ions to give a scale with a range from 0 to 14. Values equal to or between 0 and 6.9 represent the acidic range where hydrogen ions predominate and values equal to or ranging from 7.1 and 14 represent the basic range where hydroxide ions predominate. Thus, the more hydrogen ions present, the more acidic the solution.
Scientists can tell when a titration (pH) experiment passes a certain pH using compounds called indicators. Indicators are usually colorless at pH levels below that of their specified color change. A table of indicators used by the above scientists and the pH at which they change colors is presented below.

Q. Solutions A, B, and C each contain a different number of hydrogen ions. Solution A has a pH of 6.9, solution B has a pH of 7.3, and solution C has a pH of 1.3. Place the solutions in order of increasing number of hydrogen ions.
|
486 videos|517 docs|337 tests
|


 as the slope in front of the x-coordinate, which in this case is temperature.


