Test: Charts & Graphs - 2 - UCAT MCQ
10 Questions MCQ Test Quantitative Reasoning for UCAT - Test: Charts & Graphs - 2
The following graph shows the sales data from R Toys We, showing the units sold for the four most popular items in a single store in a year.
Item W is an electric plane.
Item X is a toy car racing set.
Item Y is a toy phone
Item Z is an electronic cash register toy.
Item W had the lowest returns rate at 0.5% whilst Item Z was returned at double this rate.
Q1 is January to March, Q2 is April to June, Q3 is July to September and Q4 is October to December.

Q. What was the approximate average sales for the four items in the first six months?
Item X is a toy car racing set.
Item Y is a toy phone
Item Z is an electronic cash register toy.

The following graph shows the sales data from R Toys We, showing the units sold for the four most popular items in a single store in a year.
Item W is an electric plane.
Item X is a toy car racing set.
Item Y is a toy phone
Item Z is an electronic cash register toy.
Item W had the lowest returns rate at 0.5% whilst Item Z was returned at double this rate.
Q1 is January to March, Q2 is April to June, Q3 is July to September and Q4 is October to December.
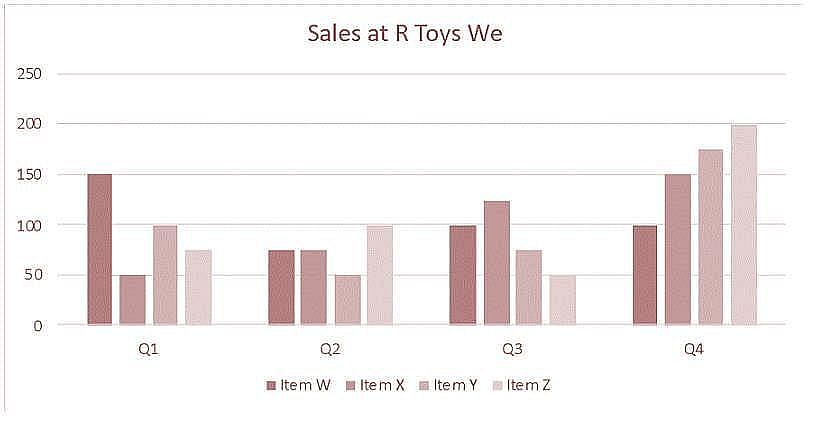
Q. Sales of Item W in Q1 of the following year declined by 20% from Q4. Sales of Item X increased by 10% in the same period. Comparing the difference between sales of Item W and sales of Item X in the two periods, by how many units did the difference in sales change?
Item X is a toy car racing set.
Item Y is a toy phone
Item Z is an electronic cash register toy.

| 1 Crore+ students have signed up on EduRev. Have you? Download the App |
The following graph shows the sales data from R Toys We, showing the units sold for the four most popular items in a single store in a year.
Item W is an electric plane.
Item X is a toy car racing set.
Item Y is a toy phone
Item Z is an electronic cash register toy.
Item W had the lowest returns rate at 0.5% whilst Item Z was returned at double this rate.
Q1 is January to March, Q2 is April to June, Q3 is July to September and Q4 is October to December.
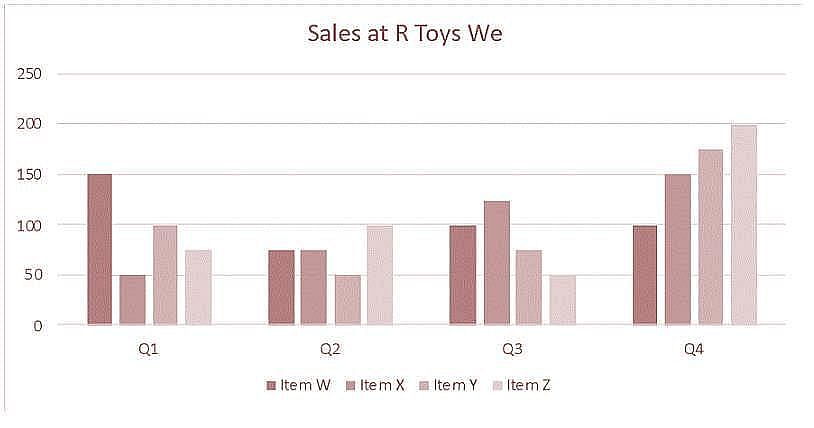
Q. Which item has the second highest percentage change in units sold between Q1 and Q4?
Item X is a toy car racing set.
Item Y is a toy phone
Item Z is an electronic cash register toy.

The following graph shows the sales data from R Toys We, showing the units sold for the four most popular items in a single store in a year.
Item W is an electric plane.
Item X is a toy car racing set.
Item Y is a toy phone
Item Z is an electronic cash register toy.
Item W had the lowest returns rate at 0.5% whilst Item Z was returned at double this rate.
Q1 is January to March, Q2 is April to June, Q3 is July to September and Q4 is October to December.

Q. For Item Z, half of the sales from Q4 were in December and the rest were split evenly between the other two months. The price of Item Z in December was £140 – a reduction of 20% on the price for the previous two months. What proportion of the revenue from sales of Item Z in Q4 came in December?
The stock price for a listed company is given over a single day.
The price is given in pence per share.
To buy shares a broker will pay an ‘offer’ price of 2p more per share than the price shown, with an additional price of £5 for stock purchases of 5000 or fewer shares. Above this level, there is a charge of 0.5%.
To sell shares a broker will be paid a ‘bid’ price 2p less than the price shown
There is a 2.5% deduction on any profit gained by buying and selling shares.
A company’s value is considered to be the price at which all the shares could be sold.
There are a total 500,000 shares in the company.
A dividend is an amount of money paid to shareholders quarterly according to how many stocks they hold.
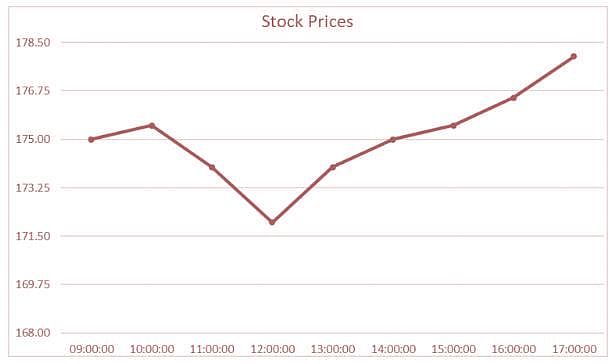
Q. What is the largest fluctuation in the value of the company across the period of an hour?
The stock price for a listed company is given over a single day.
The price is given in pence per share.
To buy shares a broker will pay an ‘offer’ price of 2p more per share than the price shown, with an additional price of £5 for stock purchases of 5000 or fewer shares. Above this level, there is a charge of 0.5%.
To sell shares a broker will be paid a ‘bid’ price 2p less than the price shown
There is a 2.5% deduction on any profit gained by buying and selling shares.
A company’s value is considered to be the price at which all the shares could be sold.
There are a total 500,000 shares in the company.
A dividend is an amount of money paid to shareholders quarterly according to how many stocks they hold.
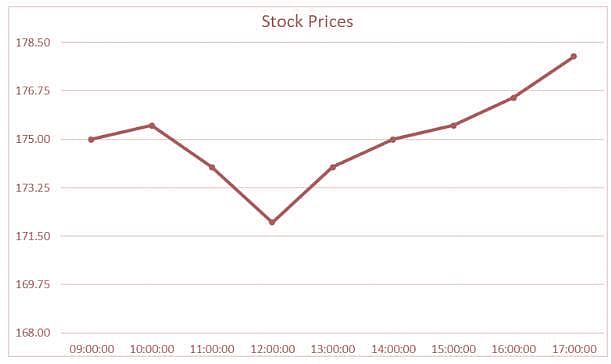
Q. What would the purchase price be for 150 shares at 13:00?
The stock price for a listed company is given over a single day.
The price is given in pence per share.
To buy shares a broker will pay an ‘offer’ price of 2p more per share than the price shown, with an additional price of £5 for stock purchases of 5000 or fewer shares. Above this level, there is a charge of 0.5%.
To sell shares a broker will be paid a ‘bid’ price 2p less than the price shown
There is a 2.5% deduction on any profit gained by buying and selling shares.
A company’s value is considered to be the price at which all the shares could be sold.
There are a total 500,000 shares in the company.
A dividend is an amount of money paid to shareholders quarterly according to how many stocks they hold.
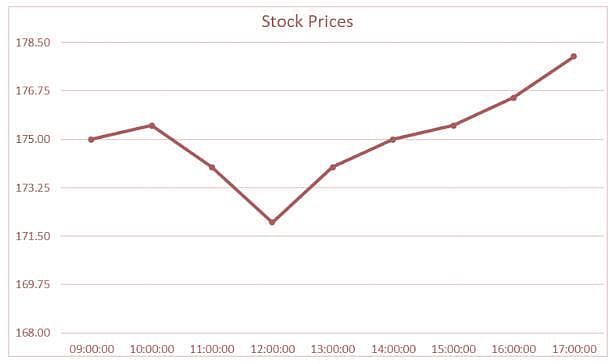
Q. A broker holds 105,000 shares. The stock’s Q1 dividend is 1% of the value of the shares at 1700 on the day shown above. The Q2 dividend is 3% higher than this. The Q3 dividend is 5% higher than the Q2 dividend. The Q4 dividend is half that of the Q1. Assuming the broker maintained the same number of shares for the whole year, to the nearest pound, what would the annual dividend be?
The stock price for a listed company is given over a single day.
The price is given in pence per share.
To buy shares a broker will pay an ‘offer’ price of 2p more per share than the price shown, with an additional price of £5 for stock purchases of 5000 or fewer shares. Above this level, there is a charge of 0.5%.
To sell shares a broker will be paid a ‘bid’ price 2p less than the price shown
There is a 2.5% deduction on any profit gained by buying and selling shares.
A company’s value is considered to be the price at which all the shares could be sold.
There are a total 500,000 shares in the company.
A dividend is an amount of money paid to shareholders quarterly according to how many stocks they hold.

Q. Jeremy bought 5000 shares at 12:00 and sold them five hours later. To the nearest pound, how much profit did he make?
In the first four innings of the season, Keaton has scored the above number of runs for his school cricket team.
His school measures success by the average number of runs scored per innings.
His bowling is above average for his age group with 15 wickets in the first four games of the season at an average of 12.5 and an economy rate of 4.

Q. In his fifth innings, Keaton scored 10 runs. By how many runs did his average runs scored fall?
Here is the graph about the number of English counties pupils in two classes at a primary school had visited.

The class size for each was 30.
Q. In the summer holidays, 50% of Class 1 students who had previously been to one county and 60% of Class 2 students who had previously been to one county visited three more counties each. Those who had previously been to two or more counties did not visit any more. What is the new proportion of the two classes who have been to four or more counties?
|
34 videos|17 docs|16 tests
|
|
34 videos|17 docs|16 tests
|


