Data Through Pictures - 1 - Free MCQ Practice Test with solutions,
MCQ Practice Test & Solutions: Test: Data Through Pictures - 1 (10 Questions)
You can prepare effectively for Class 5 Mathematics for Class 5 with this dedicated MCQ Practice Test (available with solutions) on the important topic of "Test: Data Through Pictures - 1". These 10 questions have been designed by the experts with the latest curriculum of Class 5 2026, to help you master the concept.
Test Highlights:
- - Format: Multiple Choice Questions (MCQ)
- - Duration: 20 minutes
- - Number of Questions: 10
Sign up on EduRev for free to attempt this test and track your preparation progress.

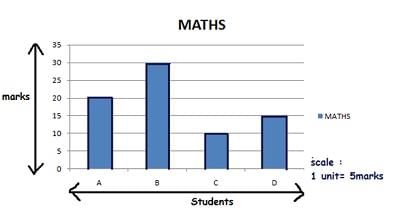
Directions: Given bar graph represents the number of students of different classes of a school who participated in a competition.
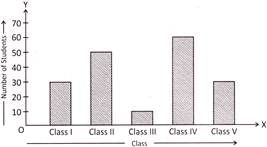
Study the bar graph and answer the question below:
How many students in total, of all five classes participated in the competition?
Detailed Solution: Question 1
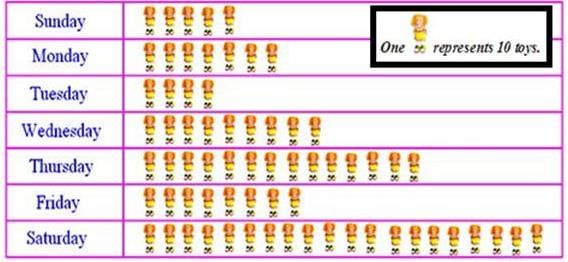
On which day were the maximum numbers of toys sold?
Detailed Solution: Question 2

Direction: given line graph represents the number of people in a store since its opening till closing at various times of a day
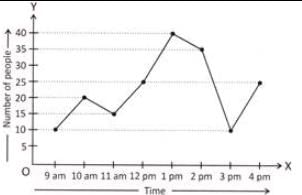
Study the line graph and answer the questions given below:
How many people were there at the store between 1 pm to 2 pm?
Study the line graph and answer the questions given below:
Detailed Solution: Question 3
Detailed Solution: Question 4
Directions: Given line graph represents the number of people in a store since its opening till closing at various times of a day.
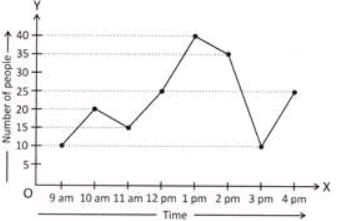
Study the line graph and answer the questions given below:
How many people were there in the store when it closed? (The store closes at 4 PM.)
Detailed Solution: Question 5
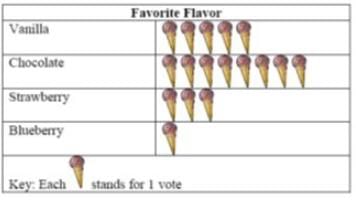
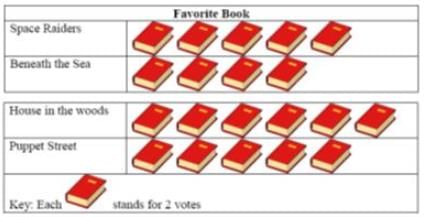
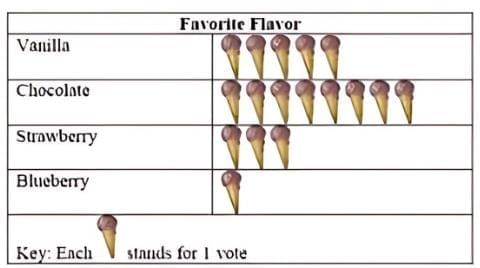
How many children in all voted for Space Raiders and Puppet Street?
Detailed Solution: Question 6
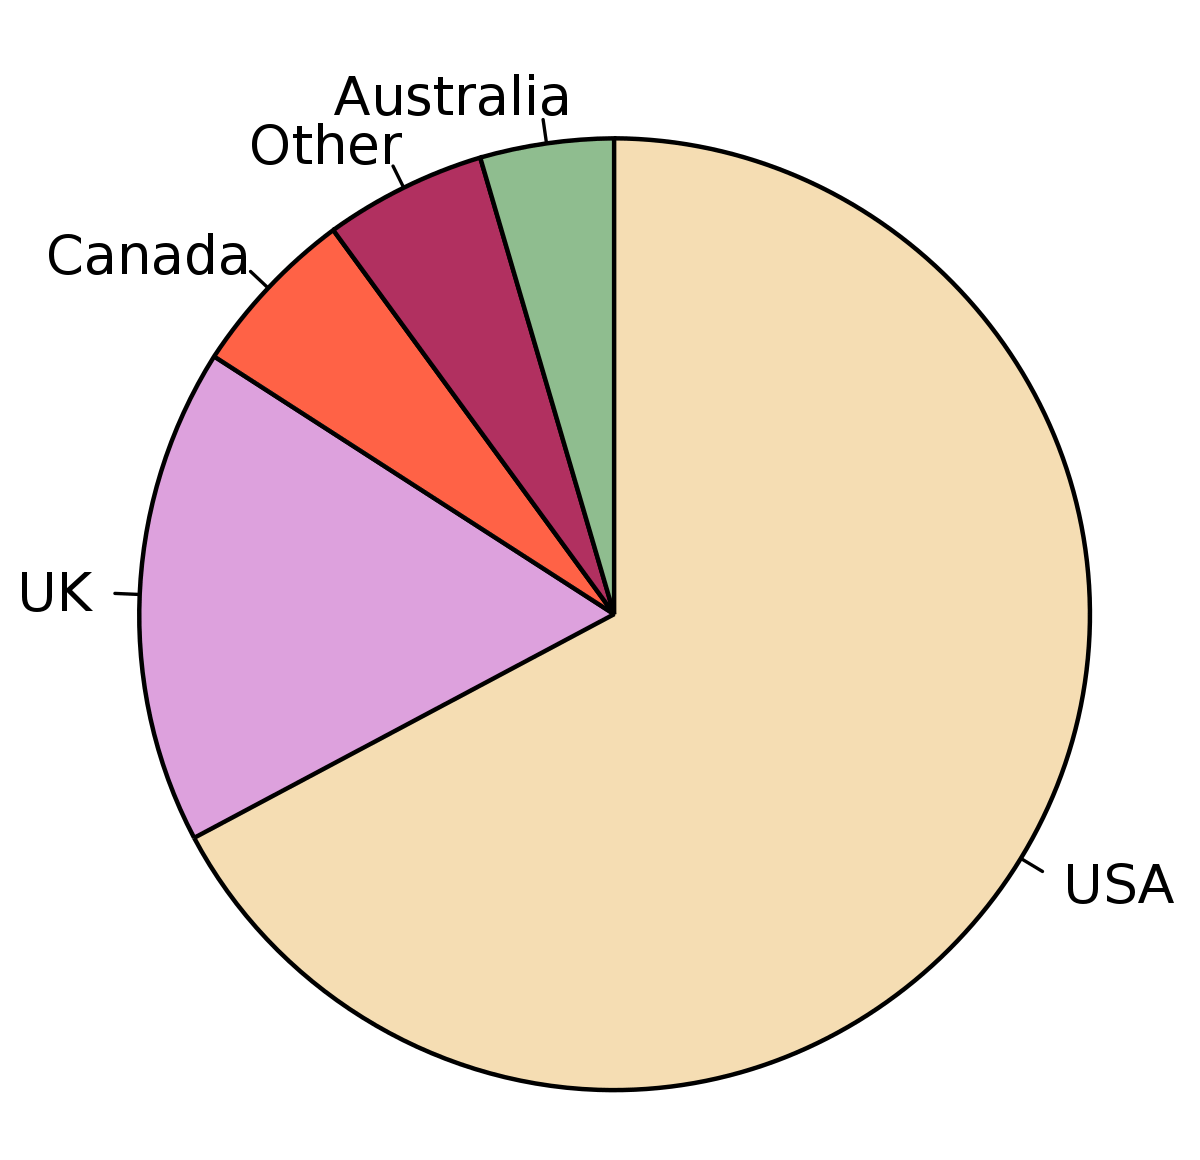
A graph in the shape of a circle to show relative sizes of data is called:
Detailed Solution: Question 7
A _________ is a representation of numbers using bars of uniform widths.
Detailed Solution: Question 8
Directions: Given line graph represents the number of people in a store since its opening till closing at various times of a day.
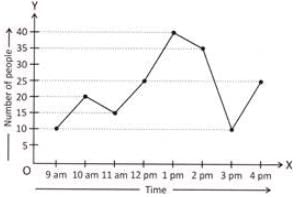
Study the line graph and answer the question given below:
How many people were there in the store when it opened?
Detailed Solution: Question 9
Detailed Solution: Question 10
76 videos|469 docs|47 tests |