Mechanical Engineering Exam  >  Mechanical Engineering Tests  >  Industrial Engineering  >  Test: Forecasting Level - 2 - Mechanical Engineering MCQ

Test: Forecasting Level - 2 - Mechanical Engineering MCQ


Test Description

10 Questions MCQ Test Industrial Engineering - Test: Forecasting Level - 2

Test: Forecasting Level - 2 for Mechanical Engineering 2024 is part of Industrial Engineering preparation. The Test: Forecasting Level - 2 questions and answers have been prepared according to the Mechanical Engineering exam syllabus.The Test: Forecasting Level - 2 MCQs are made for Mechanical Engineering 2024 Exam. Find important definitions, questions, notes, meanings, examples, exercises, MCQs and online tests for Test: Forecasting Level - 2 below.
Solutions of Test: Forecasting Level - 2 questions in English are available as part of our Industrial Engineering for Mechanical Engineering & Test: Forecasting Level - 2 solutions in Hindi for Industrial Engineering course. Download more important topics, notes, lectures and mock test series for Mechanical Engineering Exam by signing up for free. Attempt Test: Forecasting Level - 2 | 10 questions in 30 minutes | Mock test for Mechanical Engineering preparation | Free important questions MCQ to study Industrial Engineering for Mechanical Engineering Exam | Download free PDF with solutions
Test: Forecasting Level - 2 - Question 1

Demand for the month of January is given as 200; February 50; March 150. If a 9 month moving average method is used for forecasting and the forecasted value for the month of January is 100 units, then the forecast for the month of March using Exponential smoothening method is ___________

Detailed Solution for Test: Forecasting Level - 2 - Question 1

FFeb = FJan + α(DJan − FJan ) = 100 + (200 − 100) × 0.2 = 120

Fmar = FFeb + α ∙ (DFeb − FFeb) = 120 + 0.2(50 − 120)

Fmar = 106

*Answer can only contain numeric values
Test: Forecasting Level - 2 - Question 2

A hospital has used a 9-month moving average forecasting method to forecast drug and dressing inventory requirements. The actual demand for one item is as shown in the following table. Using previous moving average data, convert to an exponential forecast and find the forecast for the month 33.


Detailed Solution for Test: Forecasting Level - 2 - Question 2

9 month moving average

Ft+1 = α ∙ Dt + α(1 − α) ∙ Dt−1 + α(1 − α)2 ∙ Dt−2 + α(1 − α)3 ∙ Dt−3 + α(1 − α)4 ∙ Dt−4 + α(1 − α)5 ∙ Dt−5 + α(1 − α)6 ∙ Dt−6 + α(1 − α)7 ∙ Dt−7 + α(1 − α)8 ∙ Dt−8

Ft+1 = 0.2 × 73 + 0.2(1 − 0.2) ∙ 60 + 0.2 (1 − 0.2)2 ∙ 84+ 0.2(1 − 0.2)3 ∙ 101+ 0.2(1 − 0.2)4 ∙ 80+ 0.2(1 − 0.2)5 ∙ 71+ 0.2(1 − 0.2)6 ∙ 90+ 0.2(1 − 0.2)7 ∙ 65+ 0.2(1 − 0.2)8 ∙ 78

= 66.56

1 Crore+ students have signed up on EduRev. Have you? Download the App
Test: Forecasting Level - 2 - Question 3

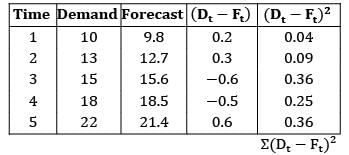
The demand and forecasted values for a new product are given in the table below.

Tracking signal value is

Detailed Solution for Test: Forecasting Level - 2 - Question 3

n = no. of periods considered

Test: Forecasting Level - 2 - Question 4

The demand for 7 weeks is as follows 90, 93, 96, 99, 102, 105, 108

‘X’ is the forecasted demand for the 8th week using 3 month moving average method. ‘Y’ is the forecasted demand for the 8th week using 4 month moving average method. ‘Z’ is the forecasted demand for the 8th week using regression analysis. What would be the relation between X, Y, Z?

Detailed Solution for Test: Forecasting Level - 2 - Question 4

Z = F7 = 108 + 3 = 111(Common difference)

∴ Z > X > Y

Test: Forecasting Level - 2 - Question 5

In a time series forecasting model, the demand for five time periods was 10, 13, 15, 18 and 22. A linear regression fit resulted in an equation F = 6.9 + 2.9 t where ‘F’ is the forecast for ‘t’ period. The mean squared error is ____________

Detailed Solution for Test: Forecasting Level - 2 - Question 5

= 1.1

Test: Forecasting Level - 2 - Question 6

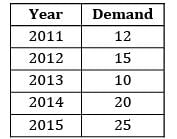
Consider the following data

Find the forecast for the year 2016 using least squares method.

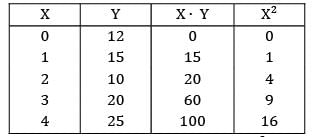
Detailed Solution for Test: Forecasting Level - 2 - Question 6

ΣX = 10 |ΣY = 82 ΣXY = 195 ΣX2 = 30

Y = a + b ∙ X

ΣY = na + b ∙ ΣX ΣXY = a ∙ ΣX + b ∙ ΣX2

82 = 5a + 10b

195 = 10a + 30b

A = 51/5; b = 31/10

Test: Forecasting Level - 2 - Question 7

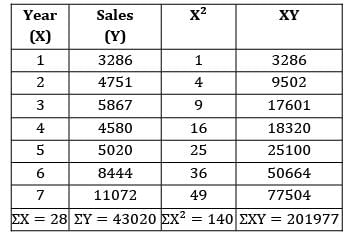
Historical data on the sales of cars for the year 2010 to 2016 is given below Find the forecast for the year 2017 using trend line method.

Detailed Solution for Test: Forecasting Level - 2 - Question 7

Y = a + bX

ΣY = na + b ∙ ΣX → (1)

ΣXY = a ∙ ΣX + b ∙ ΣX2 → (2)

43020 = 7 × a + b × 28

201977 = a × 28 + b × 140

a = 1874.7

b = 1067.75

Y = 1874.7 + 1067.75. X

Y8 = 1874.7 + 1067.75 × 8

Y7 = 10416.7 ≈ 10417

Test: Forecasting Level - 2 - Question 8

A company forecasts the future demand with “Regression analysis”. The following data is given n = 8; ΣX = 260; ΣY = 420; ΣXY = 14, 900 ΣX2 = 9750; ΣY2 = 23266

The forecast for 10th period is

Detailed Solution for Test: Forecasting Level - 2 - Question 8

Y = a + bX

ΣY = na + b ∙ ΣX

ΣXY = a ∙ ΣX + b ∙ ΣX2

420 = 8a + b × 260 ⋯ ①

14900 = 260a + b × 9750 ⋯ ②

Solving equations ① and ②

a = 21.3; b = 0.96

Y = 21.3 + 0.96 x

Y10 = 21.3 + 0.96 × 10

= 30.9 ≈ 31

*Answer can only contain numeric values
Test: Forecasting Level - 2 - Question 9

A company is introducing new product.It contains three alternatives to make the product with the following costs.

The forecasted demand estimates are as follows:

The minimum total cost is ____________


Detailed Solution for Test: Forecasting Level - 2 - Question 9

= 1500 × 0.10 + 2000 × 0.30 + 2500 × 0.25+3000 × 0.15 + 3500 × 0.12 + 4000 × 0.08

Q = 2565

Total cost = FC + VC × Q

TC)A = 25,000 + 20 × 2565

Rs. 76,300

TC)B = 45,000 + 18 × 2565

= Rs. 91,170

TC)C = 52,000 + 15 × 2565

= Rs. 90,475

Min cost = 76, 300

Test: Forecasting Level - 2 - Question 10

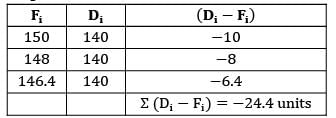
A company has forecasted the demand value for the month of June as 150 units. The smoothening constant is given as 0.2. The demand values for the month of June, July and August are constant and is given as 140 units. Determine the mean forecast error

Detailed Solution for Test: Forecasting Level - 2 - Question 10

FJune = 150 units

DJune = 140 units, DJuly = 140

DAug = 140

FJuly = FJune + α(DJune − FJune )

= 150 + 0.2(140 − 150)

= 148 units.

FAug = FJuly + α(DJuly − FJuly )

= 148 + 0.2(140 − 148)

FAug = 146.4

= −8.13 units

30 videos|40 docs|30 tests
Information about Test: Forecasting Level - 2 Page
In this test you can find the Exam questions for Test: Forecasting Level - 2 solved & explained in the simplest way possible. Besides giving Questions and answers for Test: Forecasting Level - 2, EduRev gives you an ample number of Online tests for practice

Top Courses for Mechanical Engineering

30 videos|40 docs|30 tests
Download as PDF

Top Courses for Mechanical Engineering