Graphical Representation Of Data - Free MCQ Practice Test with solutions,
MCQ Practice Test & Solutions: Test: Graphical Representation Of Data (5 Questions)
You can prepare effectively for Class 9 Mathematics (Maths) Class 9 with this dedicated MCQ Practice Test (available with solutions) on the important topic of "Test: Graphical Representation Of Data". These 5 questions have been designed by the experts with the latest curriculum of Class 9 2026, to help you master the concept.
Test Highlights:
- - Format: Multiple Choice Questions (MCQ)
- - Duration: 5 minutes
- - Number of Questions: 5
Sign up on EduRev for free to attempt this test and track your preparation progress.

In order to draw a frequency polygon by using a histogram, which of the following statements is incorrect?
A graphical representation of a frequency distribution in the form of rectangles with class interval as bases and heights proportional to corresponding frequencies such that there is no gap between any two successive rectangles is called a

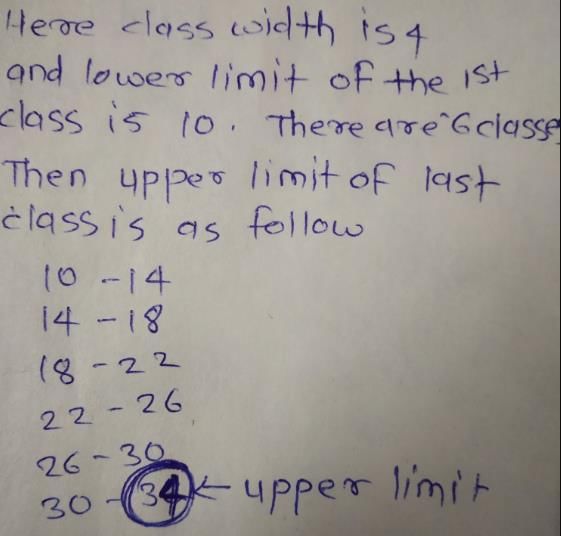
In a frequency distribution, the class-width is 4 and the lower limit of first class is 10. If there are six classes, the upper limit of last class is
Detailed Solution: Question 3
A frequency polygon is drawn for the following data. So the x-coordinate of the point having y coordinate as 21 is
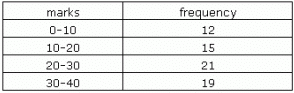
Detailed Solution: Question 4
Following table gives marks and number of students of a class:
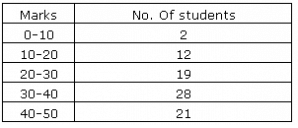
Which point on the frequency polygon will have its y coordinate as 21?
40 videos|468 docs|55 tests |