Table Analysis - 2 - Free MCQ Practice Test with solutions, GMAT Data Insights
MCQ Practice Test & Solutions: Test: Table Analysis - 2 (10 Questions)
You can prepare effectively for GMAT Data Insights for GMAT with this dedicated MCQ Practice Test (available with solutions) on the important topic of "Test: Table Analysis - 2". These 10 questions have been designed by the experts with the latest curriculum of GMAT 2026, to help you master the concept.
Test Highlights:
- - Format: Multiple Choice Questions (MCQ)
- - Duration: 20 minutes
- - Number of Questions: 10
Sign up on EduRev for free to attempt this test and track your preparation progress.

Directions: Study the following table and answer the questions.
Number of Candidates Appeared and Qualified in a Competitive Examination from Different States Over the Years.
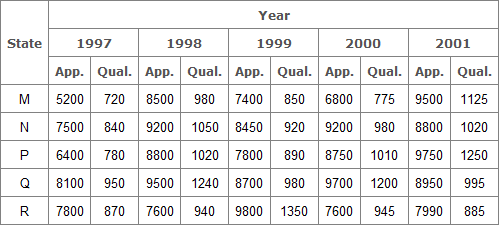
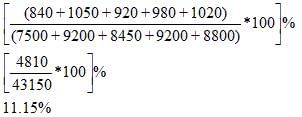
Q. Total number of candidates qualified from all the states together in 1997 is approximately what percentage of the total number of candidates qualified from all the states together in 1998?
Detailed Solution: Question 1
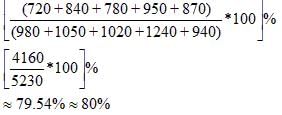
Directions: Study the following table and answer the questions.
Number of Candidates Appeared and Qualified in a Competitive Examination from Different States Over the Years.

Q. In which of the given years the number of candidates appeared from State P has maximum percentage of qualified candidates?
Detailed Solution: Question 2
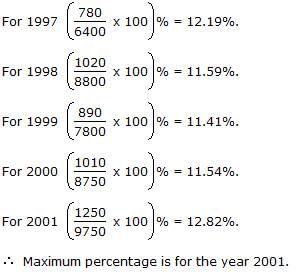

Directions: Study the following table and answer the questions.
Number of Candidates Appeared and Qualified in a Competitive Examination from Different States Over the Years.

Q. The percentage of total number of qualified candidates to the total number of appeared candidates among all the five states in 1999 is?
Detailed Solution: Question 3
Directions: Study the following table and answer the questions.
Number of Candidates Appeared and Qualified in a Competitive Examination from Different States Over the Years.

Q.What is the average candidates who appeared from State Q during the given years?
Detailed Solution: Question 4
Directions: Study the following table and answer the questions.
Number of Candidates Appeared and Qualified in a Competitive Examination from Different States Over the Years.

Q. What is the percentage of candidates qualified from State N for all the years together, over the candidates appeared from State N during all the years together?
Detailed Solution: Question 5
Directions: Study the following table chart and answer the questions.

Q. What is the different between the number of students passed with 30 as cut-off marks in Chemistry and those passed with 30 as cut-off marks in aggregate?
Detailed Solution: Question 6
Directions: Study the following table chart and answer the questions.

Q. The percentage of number of students getting at least 60% marks in Chemistry ove those getting at least 40% marks in aggregate, is approximately what according to the table chart?
Detailed Solution: Question 7
Directions: Study the following table chart and answer the questions.

Q. If it is known that at least 23 students were eligible for a Symposium on Chemistry, then the minimum qualifying marks in Chemistry for eligibility to Symposium would lie in the range?
Detailed Solution: Question 8
Directions: Study the following table chart and answer the questions.
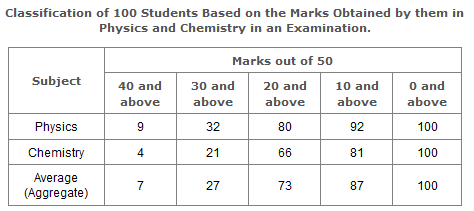
Q. If at least 60% marks in Physics are required for pursuing higher studies in Physics, how many students will be eligible to pursue higher studies in Physics?
Detailed Solution: Question 9
Directions: Study the following table chart and answer the questions.

Q. The number of students scoring less than 40% marks in aggregate is?
Detailed Solution: Question 10
25 videos|36 docs|18 tests |