Test: Tables - 2 - UCAT MCQ
20 Questions MCQ Test Quantitative Reasoning for UCAT - Test: Tables - 2
Directions: Study the following information carefully and answer the questions given beside:
The table below shows the television sets sold on different days by different sellers.

Q. Television sold by P and S together on Thursday is what percent of television sold by T on Saturday?
The table below shows the television sets sold on different days by different sellers.

Directions: Study the following information carefully and answer the questions given beside:
The table below shows the television sets sold on different days by different sellers.

Q. Find the ratio of number of television sold by Q on Monday and Sunday together to the number of television sold by R on Wednesday and Saturday together?
The table below shows the television sets sold on different days by different sellers.

| 1 Crore+ students have signed up on EduRev. Have you? Download the App |
Directions: Study the following information carefully and answer the questions given beside:
The table below shows the television sets sold on different days by different sellers.

Q. The televisions sold by P on Wednesday are of two types i.e., Samsung and LG Television in ratio 3 : 4. Find the number of LG television sold by P on Wednesday?
The table below shows the television sets sold on different days by different sellers.

Directions: Study the following information carefully and answer the questions given beside:
The table below shows the television sets sold on different days by different sellers.

Q. Find the difference between the number of Television sold by P and R together on Tuesday and the number of Television sold by S and T together on Thursday?
Directions: Study the following information carefully and answer the questions given beside:
The table below shows the television sets sold on different days by different sellers.

Q. What is the average of number of television sold by Q on Thursday, T on Saturday and S on Tuesday?
Directions : Study the following table chart carefully and answer the questions given beside.
Table shows the classification of 80 students based on the marks obtained by them in three different subjects – Maths, Physics and Chemistry.
Maximum marks = 100, Total students = 80

Q. How many students get 40 marks and above but less than 80 marks in all individual subjects?
Directions : Study the following table chart carefully and answer the questions given beside.
Table shows the classification of 80 students based on the marks obtained by them in three different subjects – Maths, Physics and Chemistry.
Maximum marks = 100, Total students = 80

Q. If passing marks in each subject is 40, then find the percentage of students passed in Chemistry?
Directions : Study the following table chart carefully and answer the questions given beside.
Table shows the classification of 80 students based on the marks obtained by them in three different subjects – Maths, Physics and Chemistry.
Maximum marks = 100, Total students = 80

Q. Find the average number of students who got less than 60 marks in Maths, Physics and Chemistry together?
Directions : Study the following table chart carefully and answer the questions given beside.
Table shows the classification of 80 students based on the marks obtained by them in three different subjects – Maths, Physics and Chemistry.
Maximum marks = 100, Total students = 80

Q. Number of students who got 40 marks and above in Chemistry is what percentage of the number of students who got less than 60 marks in Maths?
Directions : Study the following table chart carefully and answer the questions given beside.
Table shows the classification of 80 students based on the marks obtained by them in three different subjects – Maths, Physics and Chemistry.
Maximum marks = 100, Total students = 80

Q. Find the ratio of the number of students who got less than 20 marks in Maths to the number of students who got less than 40 marks in Chemistry?
Directions : Study the following table chart carefully and answer the questions given beside.
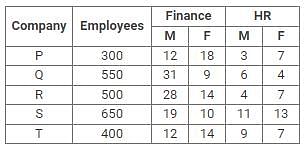
There are five companies and number of employees working in these companies is given. The number of male and female employees of Finance and HR department as a percent of the total employees is also given for each company.

Q. Find the ratio of female employees of company S in Finance to male employees of company R in HR department?
Directions : Study the following table chart carefully and answer the questions given beside.
There are five companies and number of employees working in these companies is given. The number of male and female employees of Finance and HR department as a percent of the total employees is also given for each company.

Q. What is the ratio of male employees in Finance department of company T and R together to female employees of HR department in company Q and P together?
Directions : Study the following table chart carefully and answer the questions given beside.
There are five companies and number of employees working in these companies is given. The number of male and female employees of Finance and HR department as a percent of the total employees is also given for each company.

Q. If 60% of the employees of company P in finance have MBA degree and 40% of the employees of same company in HR have MBA degree, then how many employees have MBA degree in company P in both departments together?
Directions : Study the following table chart carefully and answer the questions given beside.
There are five companies and number of employees working in these companies is given. The number of male and female employees of Finance and HR department as a percent of the total employees is also given for each company.

Q. Total number of Finance employees of company T is what percentage more than the total number of HR employees in company P? (round off to 2 decimal points)
Directions : Study the following table chart carefully and answer the questions given beside.
There are five companies and number of employees working in these companies is given. The number of male and female employees of Finance and HR department as a percent of the total employees is also given for each company.

Q. What is the difference between female employees of Finance department in all companies together (excluding company Q and S) and the female employees of HR department in all companies (excluding company Q and S)?
Directions : Study the following table chart carefully and answer the questions given beside.
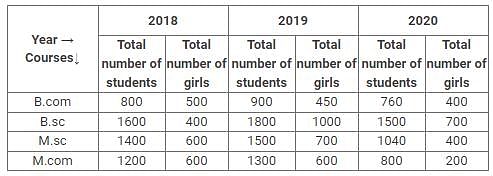
The table given shows the total number of students of a college and the number of girls who are studying in four different courses – B.com, B.sc, M.sc and M. Com in 3 different years.

Q. What is the average number of boys studying in all the four courses in the year 2019?
Directions : Study the following table chart carefully and answer the questions given beside.
The table given shows the total number of students of a college and the number of girls who are studying in four different courses – B.com, B.sc, M.sc and M. Com in 3 different years.

Q. What is the respective ratio between the total number of boys studying in courses B.sc and M.com together in the year 2018 to that of the total number of students studying in courses B.sc and M.com together in the year 2019?
Directions : Study the following table chart carefully and answer the questions given beside.
The table given shows the total number of students of a college and the number of girls who are studying in four different courses – B.com, B.sc, M.sc and M. Com in 3 different years.

Q. In 2018, 20% of boys left B.Com course and 30% of girls left M.Sc course in the same year. Rest of the students completed the course. Find the ratio of the number of boys who completed B.Com course in the year 2018 to the number of girls who left M.sc course in the same year?
Directions : Study the following table chart carefully and answer the questions given beside.
The table given shows the total number of students of a college and the number of girls who are studying in four different courses – B.com, B.sc, M.sc and M. Com in 3 different years.

Q. By what percentage is the number of boys studying in all four courses of the college in the year 2018 more than that of the number of girls studying in all four courses in the same year?
Directions : Study the following table chart carefully and answer the questions given beside.
The table given shows the total number of students of a college and the number of girls who are studying in four different courses – B.com, B.sc, M.sc and M. Com in 3 different years.

Q. What is the difference between the total number of girls studying in all four courses in the year 2018 and that of the total number of boys studying in all four courses in the year 2020?
|
34 videos|17 docs|16 tests
|
|
34 videos|17 docs|16 tests
|


