SSC CGL Exam  >  SSC CGL Tests  >  Quantitative Aptitude for SSC CGL  >  MCQ: Table Charts - 2 - SSC CGL MCQ

MCQ: Table Charts - 2 - SSC CGL MCQ


Test Description

15 Questions MCQ Test Quantitative Aptitude for SSC CGL - MCQ: Table Charts - 2

MCQ: Table Charts - 2 for SSC CGL 2025 is part of Quantitative Aptitude for SSC CGL preparation. The MCQ: Table Charts - 2 questions and answers have been prepared according to the SSC CGL exam syllabus.The MCQ: Table Charts - 2 MCQs are made for SSC CGL 2025 Exam. Find important definitions, questions, notes, meanings, examples, exercises, MCQs and online tests for MCQ: Table Charts - 2 below.
Solutions of MCQ: Table Charts - 2 questions in English are available as part of our Quantitative Aptitude for SSC CGL for SSC CGL & MCQ: Table Charts - 2 solutions in Hindi for Quantitative Aptitude for SSC CGL course. Download more important topics, notes, lectures and mock test series for SSC CGL Exam by signing up for free. Attempt MCQ: Table Charts - 2 | 15 questions in 15 minutes | Mock test for SSC CGL preparation | Free important questions MCQ to study Quantitative Aptitude for SSC CGL for SSC CGL Exam | Download free PDF with solutions
MCQ: Table Charts - 2 - Question 1

The following table gives the percentage distribution of population of five states, P, Q, R, S and T on the basis of poverty line and also on the basis of sex.
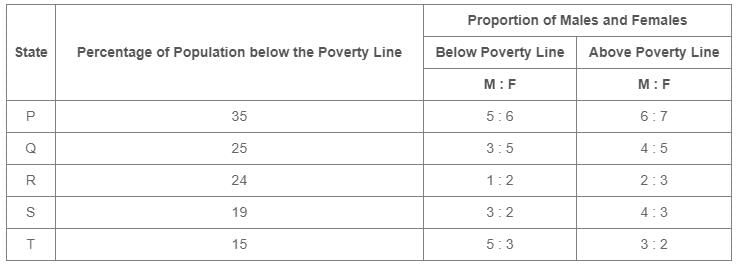
Q. If the male population above poverty line for State R is 1.9 million, then the total population of State R is?

Detailed Solution for MCQ: Table Charts - 2 - Question 1

Let the total population of State R be x million.

Then, population of State R above poverty line

    = [(100 - 24)% of x] million

And so, male population of State R above poverty line

But, it is given that male population of State R above poverty line = 1.9 million.

∴ Total population of State R = 6.25 million.

MCQ: Table Charts - 2 - Question 2

The following table gives the percentage distribution of population of five states, P, Q, R, S and T on the basis of poverty line and also on the basis of sex.
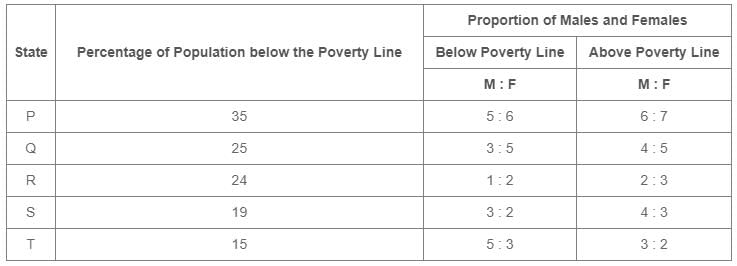
Q. What will be the male population above poverty line for State P if the female population below poverty line for State P is 2.1 million?

Detailed Solution for MCQ: Table Charts - 2 - Question 2

Female population below poverty line for State P = 2.1 million

Let the male population below poverty line for State P be x million.

∴ Population below poverty line for State P = (2.1 + 1.75) million = 3.85 million.

Let the population above poverty line for State P by y million.

Since, 35% of the total population of State P is below poverty line, therefore, 65% of the total population of State P is above poverty line i.e., the ratio of population below poverty line to that above poverty line for State P is 35 : 65.


∴ Population above poverty line for State P = 7.15 million and so, male population above poverty line for State P

MCQ: Table Charts - 2 - Question 3

The following table gives the percentage distribution of population of five states, P, Q, R, S and T on the basis of poverty line and also on the basis of sex.
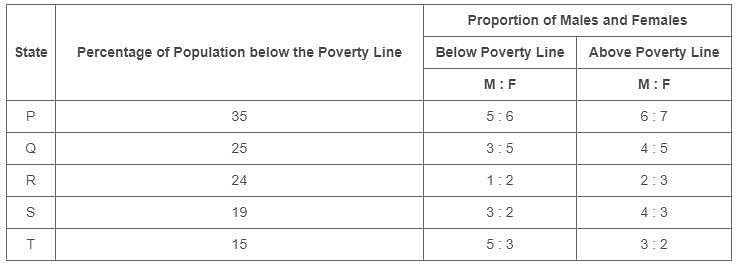
Q. If the population of males below poverty line for State Q is 2.4 million and that for State T is 6 million, then the total populations of States Q and T are in the ratio?

Detailed Solution for MCQ: Table Charts - 2 - Question 3

For State Q:

Male population below poverty line = 2.4 million.

Let the female population below poverty line be x million.

∴ Total population below poverty line = (2.4 + 4) = 6.4 million.

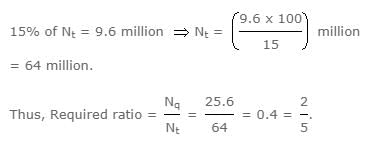
If Nq be the total population of State Q, then,

= 25.6 million.

For State T:

Male population below poverty line = 6 million.

Let the female population below poverty line be y million.

∴ Total population below poverty line = (6 + 3.6) = 9.6 million.

If Nt be the total population of State T, then,

MCQ: Table Charts - 2 - Question 4

The following table gives the percentage distribution of population of five states, P, Q, R, S and T on the basis of poverty line and also on the basis of sex.
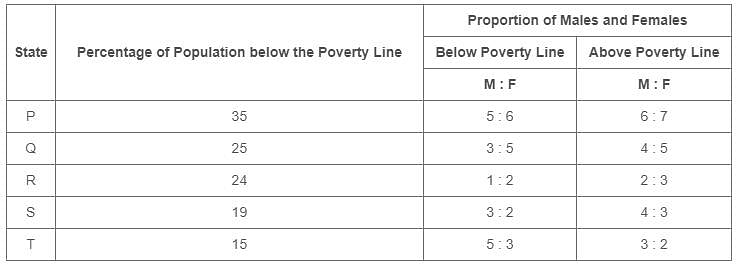
Q. What will be the number of females above the poverty line in the State S if it is known that the population of State S is 7 million?

Detailed Solution for MCQ: Table Charts - 2 - Question 4

Total population of State S = 7 million.

∴ Population above poverty line

    = [(100 - 19)% of 7] million

    = (81% of 7) million

    = 5.67 million.

And so, the number of females above poverty line in State S

= 2.43 million.

MCQ: Table Charts - 2 - Question 5

A school has four sections A, B, C, D of Class IX students.
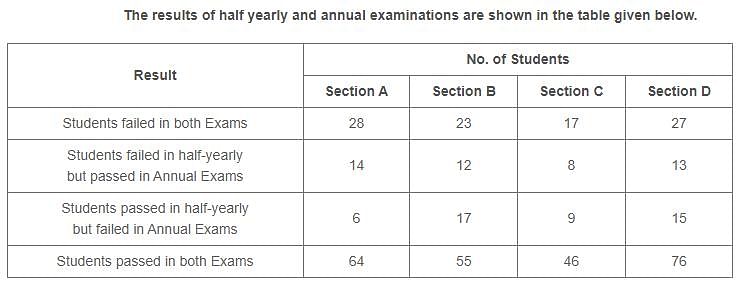
Q. Which section has the maximum success rate in annual examination?

Detailed Solution for MCQ: Table Charts - 2 - Question 5

Total number of students passed in annual exams in a section

= [ (No. of students failed in half-yearly but passed in annual exams) + (No. of students passed in both exams)] in that section

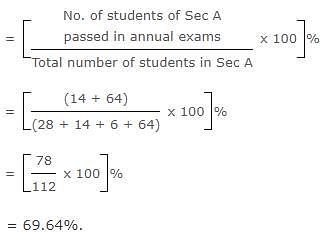
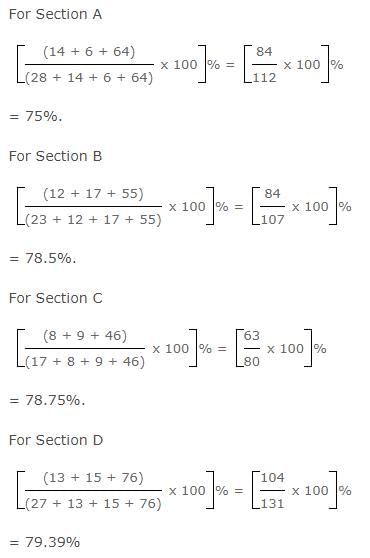
∴ Success rate in annual exams in Section A

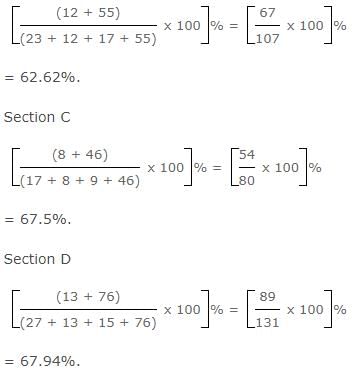
Similarly, success rate in annual exams in:

Section B

Clearly, the success rate in annual examination is maximum for Section A.

MCQ: Table Charts - 2 - Question 6

A school has four sections A, B, C, D of Class IX students.
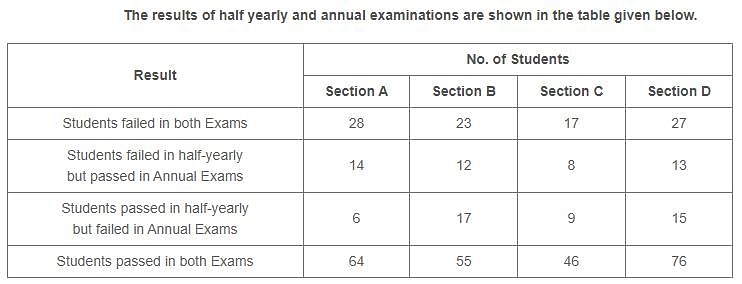
Q. Which section has the minimum failure rate in half yearly examination?

Detailed Solution for MCQ: Table Charts - 2 - Question 6

Total number of failures in half-yearly exams in a section

= [ (Number of students failed in both exams) + (Number of students failed in half-yearly but passed in Annual exams)] in that section

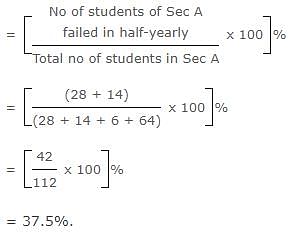
Therefore Failure rate in half-yearly exams in Section A

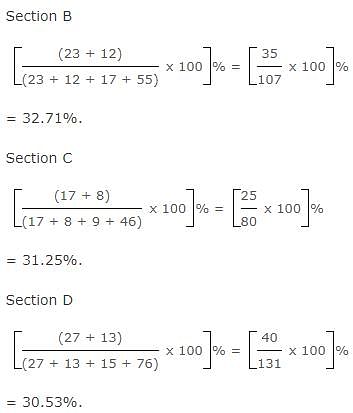
Similarly, failure rate in half-yearly exams in:

Clearly, the failure rate is minimum for Section D.

MCQ: Table Charts - 2 - Question 7

A school has four sections A, B, C, D of Class IX students.
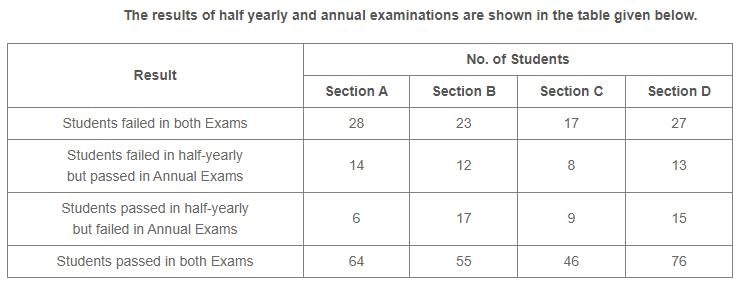
Q. How many students are there in Class IX in the school?

Detailed Solution for MCQ: Table Charts - 2 - Question 7

Since the classification of the students on the basis of their results and sections form independent groups, so the total number of students in the class:

= (28 + 23 + 17 + 27 + 14 + 12 + 8 + 13 + 6 + 17 + 9 + 15 + 64 + 55 + 46 + 76)

= 430.

MCQ: Table Charts - 2 - Question 8

A school has four sections A, B, C, D of Class IX students.
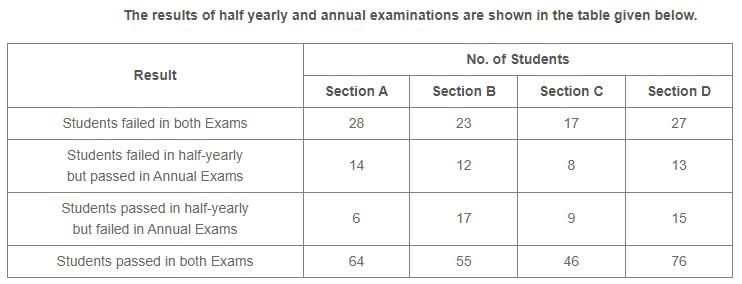
Q. If the number of students passing an examination be considered a criteria for comparison of difficulty level of two examinations, which of the following statements is true in this context?

Detailed Solution for MCQ: Table Charts - 2 - Question 8

Number of students who passed half-yearly exams in the school

= (Number of students passed in half-yearly but failed in annual exams)
+ (Number of students passed in both exams)

= (6 + 17 + 9 + 15) + (64 + 55 + 46 + 76)

= 288.

Also, Number of students who passed annual exams in the school

= (Number of students failed in half-yearly but passed in annual exams)
+ (Number of students passed in both exams)

= (14 + 12 + 8 + 13) + (64 + 55 + 46 + 76)

= 288.

Since, the number of students passed in half-yearly = the number of students passed in annual exams. Therefore, it can be inferred that both the examinations had almost the same difficulty level.

Thus Statements (a), (b) and (d) are false and Statement (c) is true.

MCQ: Table Charts - 2 - Question 9

A school has four sections A, B, C, D of Class IX students.
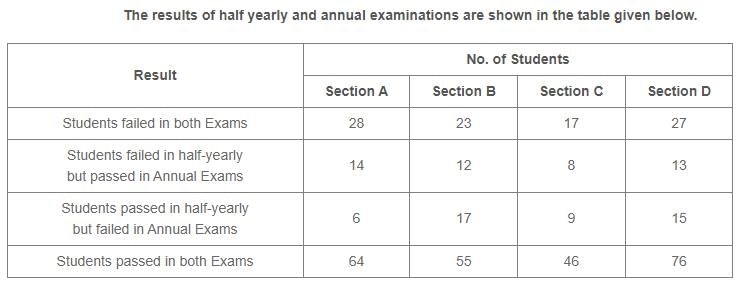
Q. Which section has the maximum pass percentage in at least one of the two examinations?

Detailed Solution for MCQ: Table Charts - 2 - Question 9

Pass percentages in at least one of the two examinations for different sections are:

Clearly, the pass percentage is maximum for Section D.

MCQ: Table Charts - 2 - Question 10

Study the following table and answer the questions.
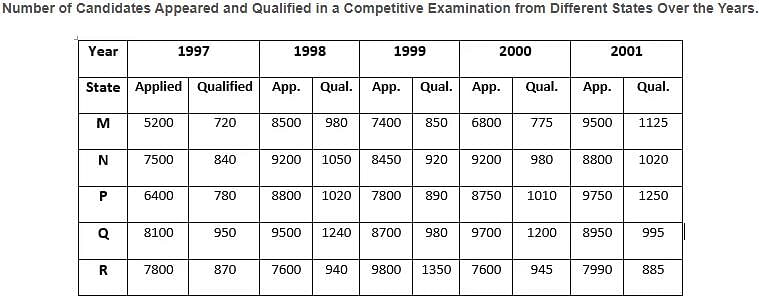
Q. Total number of candidates qualified from all the states together in 1997 is approximately what percentage of the total number of candidates qualified from all the states together in 1998?

Detailed Solution for MCQ: Table Charts - 2 - Question 10

Required percentage

MCQ: Table Charts - 2 - Question 11

Study the following table and answer the questions.
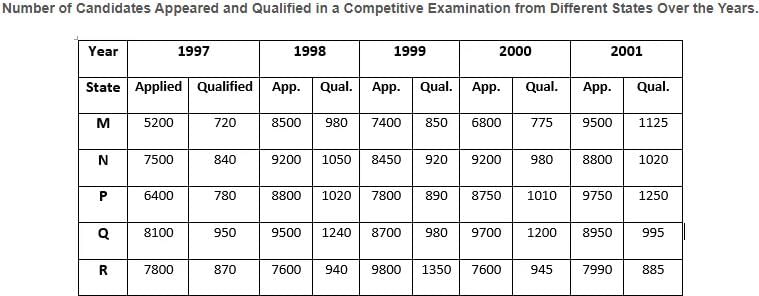
Q. The percentage of total number of qualified candidates to the total number of appeared candidates among all the five states in 1999 is?

Detailed Solution for MCQ: Table Charts - 2 - Question 11

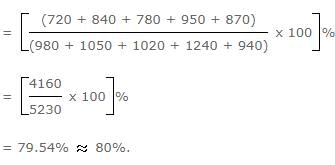
Required percentage

MCQ: Table Charts - 2 - Question 12

Study the following table and answer the questions.
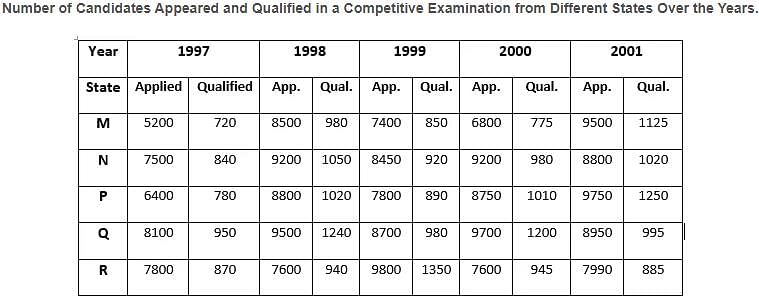
Q. What is the average candidates who appeared from State Q during the given years?

Detailed Solution for MCQ: Table Charts - 2 - Question 12

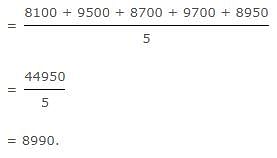
Required average

MCQ: Table Charts - 2 - Question 13

Study the following table and answer the questions.
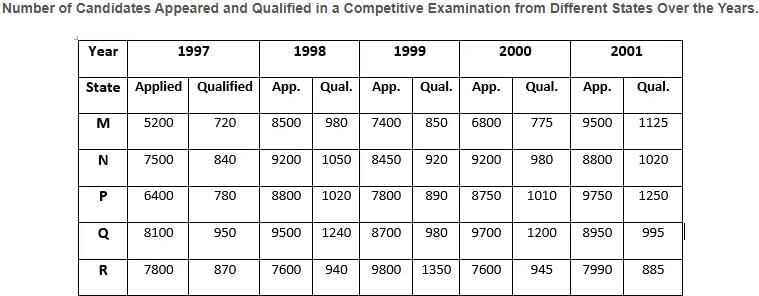
Q. In which of the given years the number of candidates appeared from State P has maximum percentage of qualified candidates?

Detailed Solution for MCQ: Table Charts - 2 - Question 13

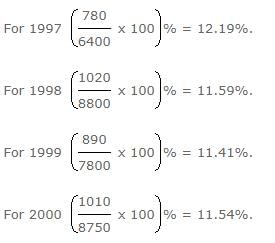
The percentages of candidates qualified to candidates appeared from State P during different years are:

∴ Maximum percentage is for the year 2001.

MCQ: Table Charts - 2 - Question 14

Study the following table and answer the questions.
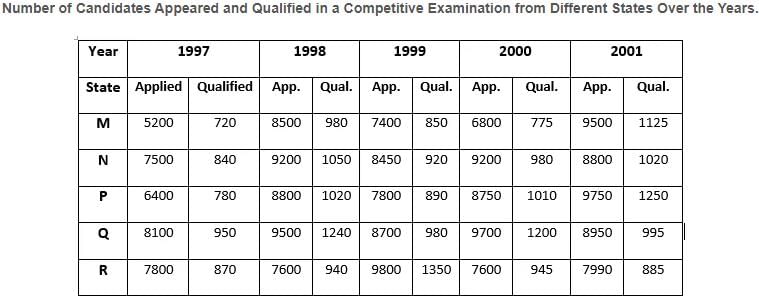
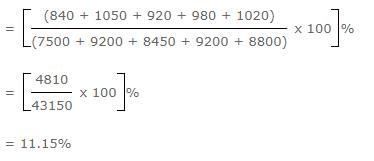
Q. What is the percentage of candidates qualified from State N for all the years together, over the candidates appeared from State N during all the years together?

Detailed Solution for MCQ: Table Charts - 2 - Question 14

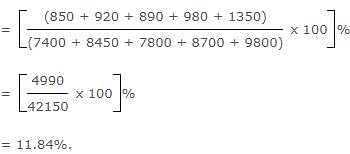
Required percentage

MCQ: Table Charts - 2 - Question 15

Study the following table and answer the questions.
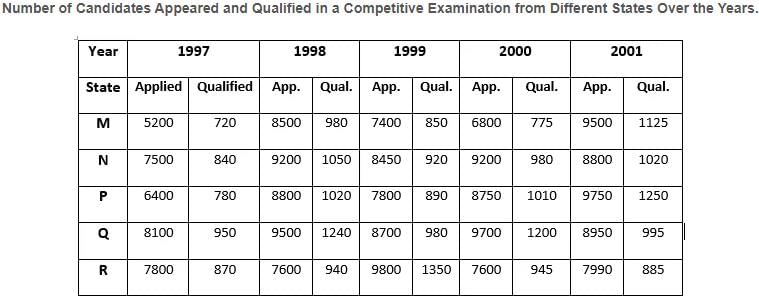
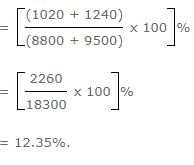
Q. Combining the states P and Q together in 1998, what is the percentage of the candidates qualified to that of the candidate appeared?

Detailed Solution for MCQ: Table Charts - 2 - Question 15

Required percentage

314 videos|170 docs|185 tests
Information about MCQ: Table Charts - 2 Page
In this test you can find the Exam questions for MCQ: Table Charts - 2 solved & explained in the simplest way possible. Besides giving Questions and answers for MCQ: Table Charts - 2, EduRev gives you an ample number of Online tests for practice
314 videos|170 docs|185 tests
Download as PDF