Class 6 Exam > Class 6 Tests > Science Olympiad Class 6 > Test: Changes Around Us - Class 6 MCQ
Test: Changes Around Us - Class 6 MCQ
Test Description
5 Questions MCQ Test Science Olympiad Class 6 - Test: Changes Around Us
Test: Changes Around Us for Class 6 2024 is part of Science Olympiad Class 6 preparation. The Test: Changes Around Us questions and answers have been
prepared according to the Class 6 exam syllabus.The Test: Changes Around Us MCQs are made for Class 6 2024 Exam. Find important
definitions, questions, notes, meanings, examples, exercises, MCQs and online tests for Test: Changes Around Us below.
Solutions of Test: Changes Around Us questions in English are available as part of our Science Olympiad Class 6 for Class 6 & Test: Changes Around Us solutions in
Hindi for Science Olympiad Class 6 course. Download more important topics, notes, lectures and mock
test series for Class 6 Exam by signing up for free. Attempt Test: Changes Around Us | 5 questions in 5 minutes | Mock test for Class 6 preparation | Free important questions MCQ to study Science Olympiad Class 6 for Class 6 Exam | Download free PDF with solutions
Test: Changes Around Us - Question 1
Observe the given figure carefully and select the correct statement.
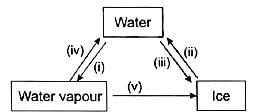

Detailed Solution for Test: Changes Around Us - Question 1
Test: Changes Around Us - Question 2
Swati classified a few changes occurring around us as shown in the table.
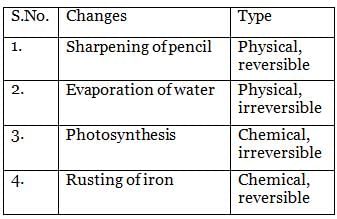
Which of the changes is/are classified correctly?

Detailed Solution for Test: Changes Around Us - Question 2
| 1 Crore+ students have signed up on EduRev. Have you? Download the App |
Test: Changes Around Us - Question 3
Read the given flow chart carefully and fill in the blanks by choosing an appropriate option.
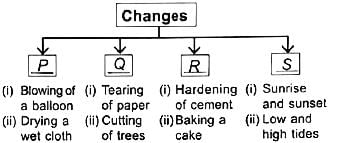
Identify P, Q, R and S.
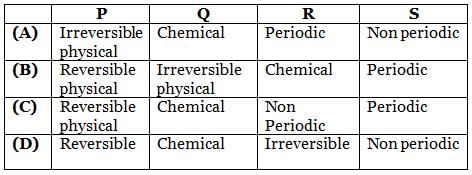

Identify P, Q, R and S.

Detailed Solution for Test: Changes Around Us - Question 3
Test: Changes Around Us - Question 4
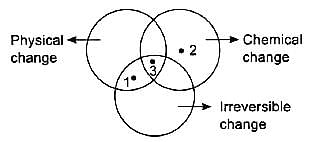
Study the given Venn diagram and identify points 1, 2 and 3.

Test: Changes Around Us - Question 5
Study the given Venn diagram.
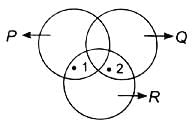
If 1 represents slaking of lime and 2 represents decomposition of calcium carbonate then P, Q and R could be respectively.
Detailed Solution for Test: Changes Around Us - Question 5
|
49 videos|108 docs|105 tests
|
Information about Test: Changes Around Us Page
In this test you can find the Exam questions for Test: Changes Around Us solved & explained in the simplest way possible.
Besides giving Questions and answers for Test: Changes Around Us, EduRev gives you an ample number of Online tests for practice
|
49 videos|108 docs|105 tests
|
Download as PDF


