JEE Exam  >  JEE Test  >  Mathematics (Maths) Main & Advanced  >  Test: Statistics- 1 - JEE MCQ

Statistics- 1 - Free MCQ Practice Test with solutions, JEE Maths


MCQ Practice Test & Solutions: Test: Statistics- 1 (25 Questions)

You can prepare effectively for JEE Mathematics (Maths) for JEE Main & Advanced with this dedicated MCQ Practice Test (available with solutions) on the important topic of "Test: Statistics- 1". These 25 questions have been designed by the experts with the latest curriculum of JEE 2026, to help you master the concept.

Test Highlights:

  • - Format: Multiple Choice Questions (MCQ)
  • - Duration: 25 minutes
  • - Number of Questions: 25

Sign up on EduRev for free to attempt this test and track your preparation progress.

Test: Statistics- 1 - Question 1

A batsman scores runs in 10 innings 38,70,48,34,42,55,63,46,54 and 44, then the mean deviation is

Detailed Solution: Question 1

Arranging the given data in ascending order,
we have 34, 38, 42, 44, 46, 48, 54, 55, 63, 70
Here, Median M = (46+48)/2
=47
(∵ n = 10, median is the mean of 5th and 6th items)
∴ Mean deviation = ∑|xi−M|/n
=∑|xi−47|/10
= (13+9+5+3+1+1+7+8+16+23)/10
=8.6

Test: Statistics- 1 - Question 2

The S.D. of the observations 22,26,28,20,24,30 is

Detailed Solution: Question 2

μ = (22 + 26 + 28 + 20 + 24 + 30)/6
= 150/6 
= 25
x(i) = (xi - μ)2
x(22) = (22-25)2 = 9
x(26) = (26-25)2 = 1
x(28) = (28-25)2 = 9
x(20) = (20-25)2 = 25
x(24) = (24-25)2 = 1
x(30) = (30-25)2 = 25

(xi - μ)2  = 70
Standard deviation : [(xi - μ)2]/N
= (70/6)½
= 3.42

Test: Statistics- 1 - Question 3

The two lines of regression are 2x - 7y + 6 = 0 and 7x – 2y +1 = 0. What is correlation coefficient between x and y ?

Detailed Solution: Question 3

ρ = (b(xy) * b(yx))
But sign of ρρ is same as sign of b(xy), b(yx)
Therefore, ρ = 2/7

Test: Statistics- 1 - Question 4

The two lines of regression are x + 4y = 3 and 3x +y = 15. value of x for y = 3 is

Detailed Solution: Question 4

Given lines are x+4y=3   (i) 
& 3x+y=15        (ii)
We first check which of the line (i) & (ii) is line of regression y
on x and x on y. Let line x+4y=3 be the line of regression x on y, then
other be the line of regression y on x.
∴ From (i) i.e. line of regression x on y we have x=−4y+3
∴ b(xy)=regression coefficient x on y=−4 and 3x+y=15
∴ y=−3x+15
∴ b(yx)=regression coefficient y on x=-3
Now count r2=b(yx)b(xy)=(−4)(−3)=12
⇒ ∣r∣=2(3)1/2
​which is not possible as 0≤r2≤1. So our assumption is wrong
and line x+4y=3 is line of regression y on x & 3x+y=15 is line of
regression x on y.
∴ 3x+y=15
⇒ x=(15−y)/3
⇒ x=(15−3)/3   (By putting y=3)
​= 4

Test: Statistics- 1 - Question 5

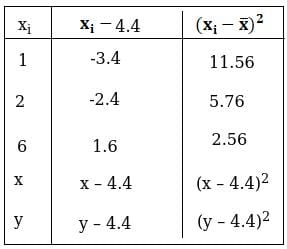
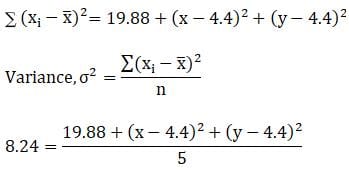
The mean of 5 observations is 4.4 and their variance is 8.24. If three observations are 1,2 and 6, the other two observations are

Detailed Solution: Question 5

Let the other nos. be a and b
then (x+y+1+2+6)/5 = 4.4
x + y = 13 ---------------------(1)
Variance = 8.24


41.2 = 19.88 + (x2 + 19.36 – 8.8x) + (y2 + 19.36 – 8.8y) 
21.32 = x2 + y2 + 38.72 – 8.8(x + y) 
x2 + y2 + 38.72 – 8.8(13) – 21.32 = 0 
(using equation (1)) 
x2 + y2 – 97 = 0 …(2) 
Squaring equation (1) both the sides, 
we get (x + y)2 = (13)^2 
x2 + y2 + 2xy = 169 
97 + 2xy = 169 
(using equation (2)) 
xy = 36 or x = 36/y (1)
⇒ 36/y + y = 13 
y2 + 36 = 13y 
y2 – 13y + 36 = 0 
(y – 4)(y – 9) = 0 
Either (y – 4) = 0 or (y – 9) = 0 
⇒ y = 4 or y = 9 
For y = 4 x = 36/y 
= 36/4 = 12 
For y = 9 
x = 36/9 
x = 4 
Thus, remaining two observations are 4 and 9.

Test: Statistics- 1 - Question 6

For a moderately skewed distribution, quartile deviation and the standard deviation are related by

Detailed Solution: Question 6

The relationship between the mean, quartile and the standard deviation are as follows:
Mean Deviation is the mean of all the absolute deviations of a set of data.
Quartile deviation is the difference between “first and third quartiles” in any distribution.
Standard deviation measures the “dispersion of the data set” that is relative to its mean.
Mean Deviation = 4/5 × Quartile deviation
Standard Deviation = 3/2 × Quartile deviation

Test: Statistics- 1 - Question 7

The H.M. of 4,8,16 is

Detailed Solution: Question 7

Test: Statistics- 1 - Question 8

The Mode of the following items is 0,1,6,7,2,3,7,6,6,2,6,0,5,6,0.

Detailed Solution: Question 8

To find the mode, we count how many times each number appears:

  • 0 appears 3 times.

  • 1 appears 1 time.

  • 6 appears 5 times.

  • 7 appears 2 times.

  • 2 appears 2 times.

  • 3 appears 1 time.

  • 5 appears 1 time.

Since 6 occurs the most frequently (5 times), the mode is 6.

Thus, the correct answer is:

D: 6

Test: Statistics- 1 - Question 9

The coefficient of correlation r satisfies

Detailed Solution: Question 9

Answer: A: |r| ≤ 1

Explanation:

The correlation coefficient (r) measures the strength and direction of the linear relationship between two variables. Its value always lies within the range -1 to +1, inclusive. This means:

  • If r = 1, there is a perfect positive linear relationship.

  • If r = 0, there is no linear relationship.

  • If r = -1, there is a perfect negative linear relationship.

Thus, the absolute value of r (|r|) satisfies |r| ≤ 1. This ensures that the correlation coefficient is always bounded within the interval [-1, 1].

Why other options are incorrect:

  • Option B (0 < r < 1): Incorrect because r can also take negative values (for example, -1 < r < 0).

  • Option C (|r| > 1): Incorrect because the correlation coefficient cannot exceed 1 in magnitude.

  • Option D (-1 < r < 0): Incorrect because r can also take positive values or be 0 or ±1.

Final Answer: A: |r| ≤ 1

Test: Statistics- 1 - Question 10

S.D. of a data is 6. When each observation is increased by 1, then the S.D. of new data is

Detailed Solution: Question 10

Answer: B: 6

Explanation: When a constant is added to every observation in a data set, the spread or dispersion of the data does not change. Therefore, adding 1 to each observation leaves the standard deviation unchanged.

Test: Statistics- 1 - Question 11

The variance of first 50  even natural numbers is :

Detailed Solution: Question 11

First 50 even natural numbers are 2,4,6,......,100

Test: Statistics- 1 - Question 12

The scores of 15 students in an examination were recorded as 10,5,8,16,18,20,8,10,16,20,18,11,16,14 and 12. After calculating the mean, median and mode, an error is found. One of the values is wrongly written as 16 instead of 18.Which of the following measures of central tendency will change ?

Detailed Solution: Question 12

Mean of the scores = 202/15
Mean of the correct scores = 200/15
i.e., Mean changes.
Median is same for both cases i.e., 14.
Mode is proportional to mean.

Test: Statistics- 1 - Question 13

The mean weight of a group of 10 items is 28 and that of another group of n items is 35.The mean of combined group of 10 + n items is found to be 30. The value of n is

Detailed Solution: Question 13

Explanation: The total weight of the first group is 10 × 28 = 280. Let the number of items in the second group be n, so its total weight is 35 × n = 35n. For the combined group of (10 + n) items with a mean of 30, the total weight is 30 × (10 + n). Setting up the equation:

280 + 35n = 30 × (10 + n)

Expanding the right side gives:

280 + 35n = 300 + 30n

Subtracting 30n from both sides:

280 + 5n = 300

Subtracting 280 from both sides:

5n = 20

Dividing by 5:

n = 4

Test: Statistics- 1 - Question 14

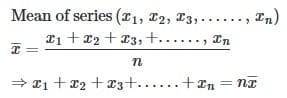
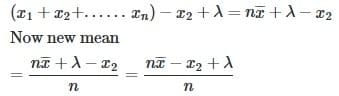
The mean of the series  x1, x2, ........ xn  is . If  x2  is replaced by λ, then what is the new mean?

Detailed Solution: Question 14


Now we will replace x2 by λ
So number of elements in series will not change.
New series will include λ and exclude x2
Hence new series sum:

Test: Statistics- 1 - Question 15

The measure of variation which is least affected by extreme items is

Detailed Solution: Question 15

Answer: D: quartile deviation

Explanation: Quartile deviation, also known as the semi-interquartile range, is based on the quartiles of the data and is less influenced by extreme values. Unlike measures such as range, standard deviation, or mean deviation, quartile deviation focuses on the middle 50% of the data, making it a more robust measure of dispersion when extreme items are present.

Test: Statistics- 1 - Question 16

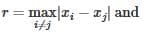
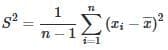
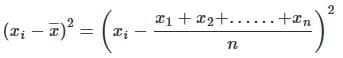
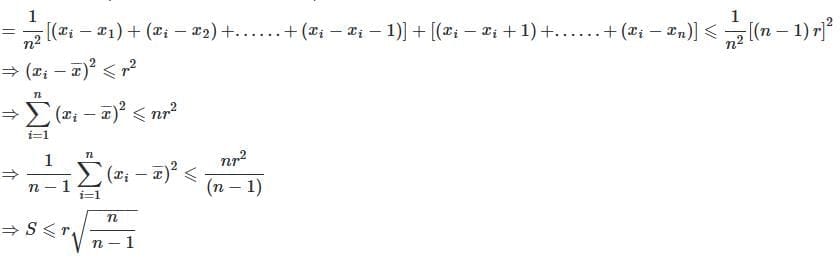
Let r be the range and  
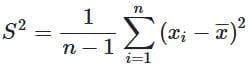
be the S.D. of a set of observations x1,x2......,xn, then :

Detailed Solution: Question 16

We have,


Now, consider

Test: Statistics- 1 - Question 17

If the standard deviation of the observations −5,−4,−3,−2,−1,0,1,2,3,4,5 is √10. The standard deviation of observations 15,16,17,18,19,20,21,22,23,24,25 will be :

Detailed Solution: Question 17

The new observations are obtained by adding 20 to each. Hence, σ does not change.

Test: Statistics- 1 - Question 18

If the coefficient of variation between x and y is 0.28, covariance between x and y is 7.6, and the variance of x is 9, then the S.D. of the y series is

Detailed Solution: Question 18

Correlation coefficient = cov (x,y)/ (std deviation (x) ×std deviation (y))
Correlation coefficient  = 0.28
cov (x,y) = 7.6
variance of x is 9.  
=> std deviation (x) = √variance  of X = √9 = 3
=>  0.28  = 7.6 / ( 3 * std deviation (y))
=> std deviation (y) = 7.6 / ( 3 * 0.28)
=> std deviation (y) = 9.05
standard deviation of Y series = 9.05

Test: Statistics- 1 - Question 19

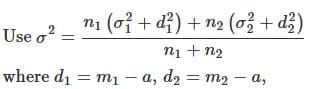
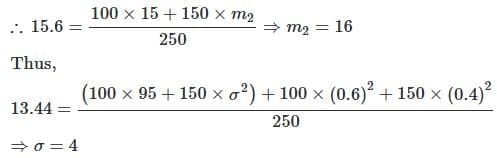
The first of two samples has 100 items with mean 15 and SD 3. If the whole group has 250 items with mean 15.6 and SD =√13.44 the SD of the second group is :

Detailed Solution: Question 19


a being the meanof the whole group
Let m2= mean of the second group

Test: Statistics- 1 - Question 20

The Q.D. of the daily wages (in Rs) of 7 persons given below: 12,7,15,10,17,19,25 is

Detailed Solution: Question 20

To calculate the quartile deviation (Q.D.), follow these steps:

  1. Arrange the data in ascending order: 7, 10, 12, 15, 17, 19, 25

  2. Find the median (middle value). Since there are 7 data points, the median is the 4th value: Median = 15

  3. Divide the data into the lower and upper halves (excluding the median):

    • Lower half: 7, 10, 12

    • Upper half: 17, 19, 25

  4. Find the first quartile (Q1) which is the median of the lower half: Q1 = 10

  5. Find the third quartile (Q3) which is the median of the upper half: Q3 = 19

  6. Compute the quartile deviation using: Quartile Deviation = (Q3 - Q1) / 2 = (19 - 10) / 2 = 9 / 2 = 4.5

Thus, the Q.D. of the daily wages is 4.5, and the correct answer is:

A: 4.5

Test: Statistics- 1 - Question 21

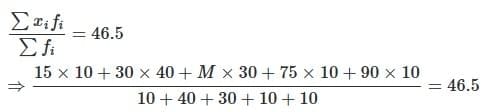
In the following frequency distribution, class limits of some of the class intervals and mid-value of a class are missing. However, the mean of the distribution is known to be 46.5

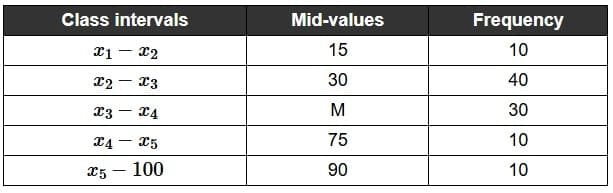
the values of x1,x2,x3,x4,x5 respectively will be :

Detailed Solution: Question 21

∴ M = 55
So the class intervals can be
10−20,20−40,40−70,70−80,80−100

Test: Statistics- 1 - Question 22

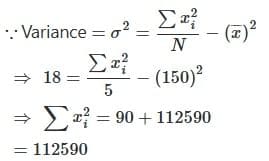
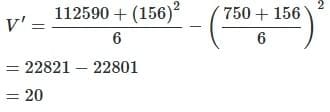
5 students of a class have an average height 150 cm and variance 18 cm2.  A new student, whose height is 156 cm,
 joined them. The variance (in cm2) of the height of these six students is:

Detailed Solution: Question 22

Then, variance of the height of six students

Test: Statistics- 1 - Question 23

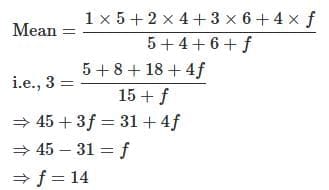
Consider the frequency distribution of the given numbers.

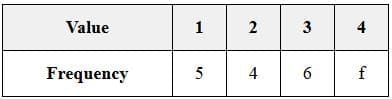
If the mean is known to be 3, then the value of f is :

Detailed Solution: Question 23

Test: Statistics- 1 - Question 24

If in moderately asymmetrical distribution mode and mean of the data are 6 μ and 9 μ respectively, then median is

Detailed Solution: Question 24

Median = [mode + 2(mean)]/3
= [6μ+2(9μ)]/3
= 24μ/3
= 8μ

Test: Statistics- 1 - Question 25

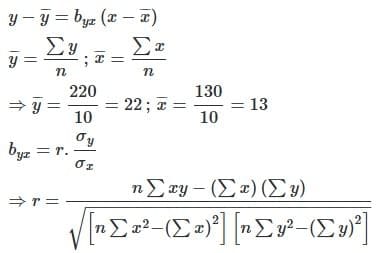
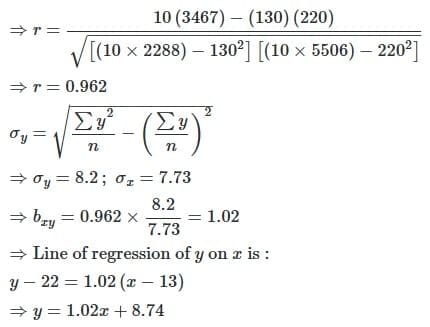
For 10  observations on price (x) and supply (y) , the following data was obtained :
∑x=130, ∑y=220, ∑x2=2288, ∑y2=5506 and ∑xy=3467.

What is line of regression of y on x?

Detailed Solution: Question 25

Line of regression of y on x is:

173 videos|510 docs|154 tests
Information about Test: Statistics- 1 Page
In this test you can find the Exam questions for Test: Statistics- 1 solved & explained in the simplest way possible. Besides giving Questions and answers for Test: Statistics- 1, EduRev gives you an ample number of Online tests for practice
Download as PDF