Bank Exams Exam  >  Bank Exams Tests  >  IBPS Clerk Prelims 2024 Preparation  >  Practice Test: Table Charts - 2 - Bank Exams MCQ

Practice Test: Table Charts - 2 - Bank Exams MCQ


Test Description

5 Questions MCQ Test IBPS Clerk Prelims 2024 Preparation - Practice Test: Table Charts - 2

Practice Test: Table Charts - 2 for Bank Exams 2024 is part of IBPS Clerk Prelims 2024 Preparation preparation. The Practice Test: Table Charts - 2 questions and answers have been prepared according to the Bank Exams exam syllabus.The Practice Test: Table Charts - 2 MCQs are made for Bank Exams 2024 Exam. Find important definitions, questions, notes, meanings, examples, exercises, MCQs and online tests for Practice Test: Table Charts - 2 below.
Solutions of Practice Test: Table Charts - 2 questions in English are available as part of our IBPS Clerk Prelims 2024 Preparation for Bank Exams & Practice Test: Table Charts - 2 solutions in Hindi for IBPS Clerk Prelims 2024 Preparation course. Download more important topics, notes, lectures and mock test series for Bank Exams Exam by signing up for free. Attempt Practice Test: Table Charts - 2 | 5 questions in 7 minutes | Mock test for Bank Exams preparation | Free important questions MCQ to study IBPS Clerk Prelims 2024 Preparation for Bank Exams Exam | Download free PDF with solutions
Practice Test: Table Charts - 2 - Question 1

Study the following table and answer the questions based on it.

Number of Candidates Appeared, Qualified and Selected in a Competitive Examination from Five States Delhi, H.P, U.P, Punjab and Haryana Over the Years 1994 to 1998
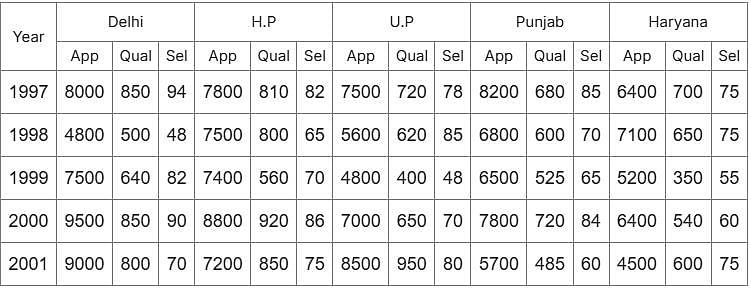
Q.For which state the average number of candidates selected over the years is the maximum?

Detailed Solution for Practice Test: Table Charts - 2 - Question 1

The average number of candidates selected over the given period for various states are:

For Delhi = (94 + 48 + 82 + 90 + 70)/5 = 384/5 = 76.8

For H.P. = (82 + 65 + 70 + 86 + 75)/5 = 378/5= 75.6

For U.P. = (78 + 85 + 48 + 70 + 80)/5 = 361/5 = 72.2

For Punjab = (85 + 70 + 65 + 84 + 60)/5 = 364/5 = 72.8

For Haryana = (75 + 75 + 55 + 60 + 75)/5 = 340/5 = 68

Clearly, this average is the maximum for Delhi that is 76.8

Practice Test: Table Charts - 2 - Question 2

Study the following table and answer the questions based on it.

Number of Candidates Appeared, Qualified and Selected in a Competitive Examination from Five States Delhi, H.P, U.P, Punjab and Haryana Over the Years 1994 to 1998
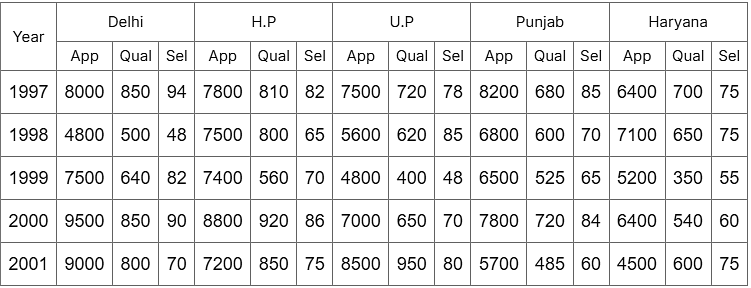

Q.The percentage of candidates qualified from Punjab over those appeared from Punjab is highest in the year?

Detailed Solution for Practice Test: Table Charts - 2 - Question 2

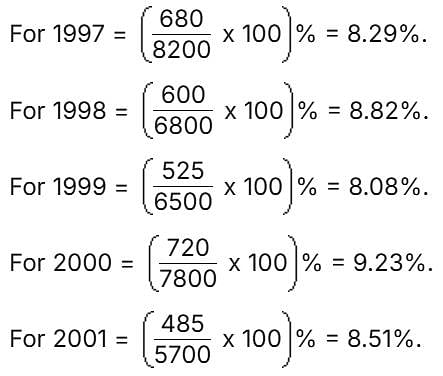
The percentages of candidates qualified from Punjab over those appeared from Punjab during different years are:

1 Crore+ students have signed up on EduRev. Have you? Download the App
Practice Test: Table Charts - 2 - Question 3

Study the following table and answer the questions based on it.

Number of Candidates Appeared, Qualified and Selected in a Competitive Examination from Five States Delhi, H.P, U.P, Punjab, and Haryana Over the Years 1994 to 1998
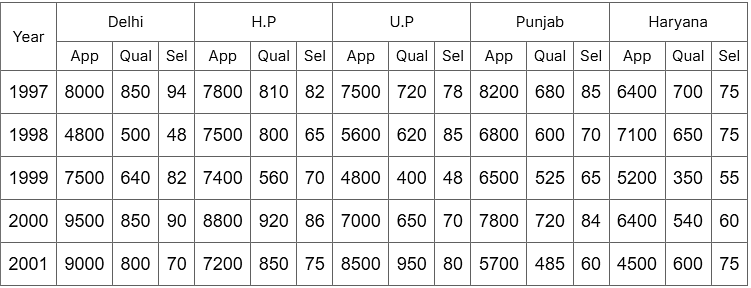
Q. Which State/UT had the least percentage of selected candidates in 1997 with respect to  appearing candidates?

Detailed Solution for Practice Test: Table Charts - 2 - Question 3

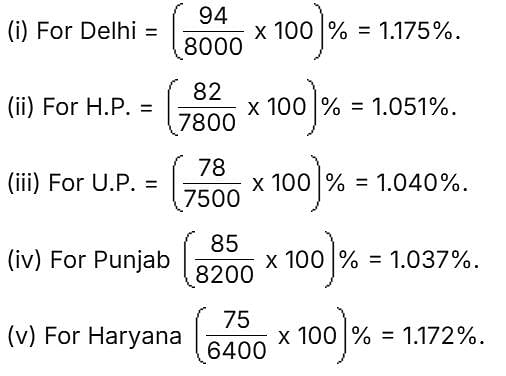
The percentages of candidates selected over the candidates appeared in 1997, for various states are:

Practice Test: Table Charts - 2 - Question 4

Study the following table and answer the questions.

Number of Candidates Appeared, Qualified and Selected in a Competitive Examination from Five States Delhi, H.P, U.P, Punjab and Haryana Over the Years 1994 to 1998.
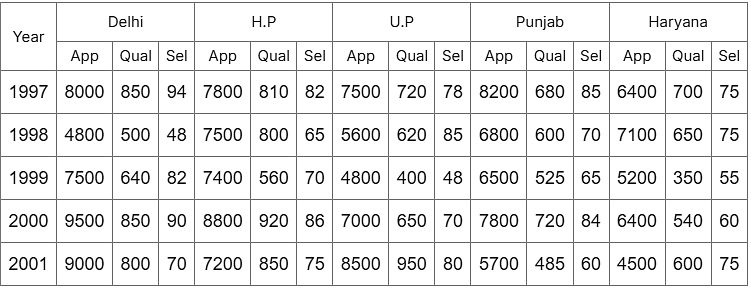
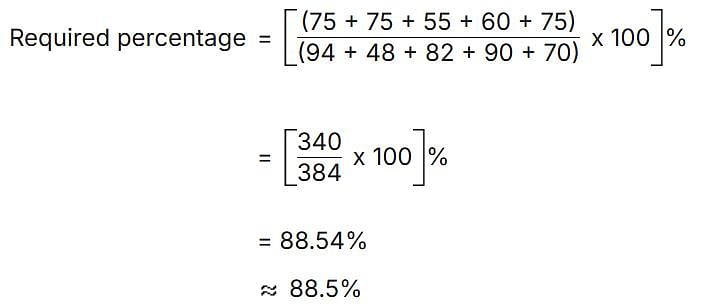
Q. The number of candidates selected from Haryana during the period under review is approximately what percent of the number selected from Delhi during this period?

Detailed Solution for Practice Test: Table Charts - 2 - Question 4

Practice Test: Table Charts - 2 - Question 5

Study the following table and answer the questions.

Number of Candidates Appeared, Qualified and Selected in a Competitive Examination from Five States Delhi, H.P, U.P, Punjab and Haryana Over the Years 1994 to 1998
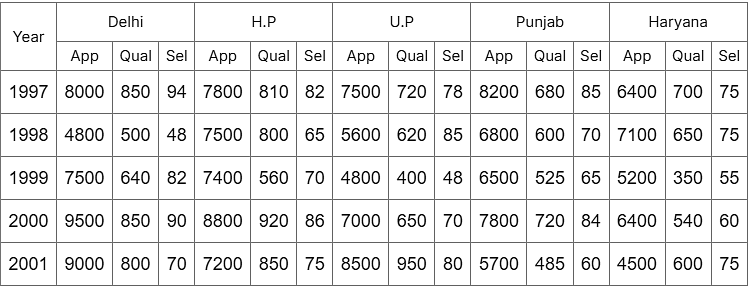
Q. In which of the given years the number of candidates appeared from State UP has maximum percentage of selected candidates?

Detailed Solution for Practice Test: Table Charts - 2 - Question 5
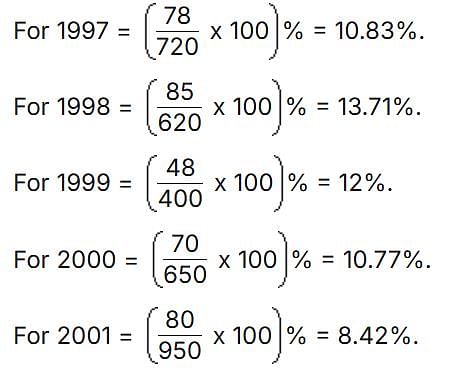
  • The percentages of candidates selected to candidates appear from State UP during different years are:
  • As we can clearly see there are 13.71% of selected candidates in 1998 which is the highest among all the years.
296 videos|297 docs|179 tests
Information about Practice Test: Table Charts - 2 Page
In this test you can find the Exam questions for Practice Test: Table Charts - 2 solved & explained in the simplest way possible. Besides giving Questions and answers for Practice Test: Table Charts - 2, EduRev gives you an ample number of Online tests for practice

Top Courses for Bank Exams

296 videos|297 docs|179 tests
Download as PDF

Top Courses for Bank Exams