Humanities/Arts Exam  >  Humanities/Arts Tests  >  Geography Class 11  >  Test: World Climate and Climate Change- Graph Based Type Questions - Humanities/Arts MCQ

Test: World Climate and Climate Change- Graph Based Type Questions - Humanities/Arts MCQ


Test Description

12 Questions MCQ Test Geography Class 11 - Test: World Climate and Climate Change- Graph Based Type Questions

Test: World Climate and Climate Change- Graph Based Type Questions for Humanities/Arts 2024 is part of Geography Class 11 preparation. The Test: World Climate and Climate Change- Graph Based Type Questions questions and answers have been prepared according to the Humanities/Arts exam syllabus.The Test: World Climate and Climate Change- Graph Based Type Questions MCQs are made for Humanities/Arts 2024 Exam. Find important definitions, questions, notes, meanings, examples, exercises, MCQs and online tests for Test: World Climate and Climate Change- Graph Based Type Questions below.
Solutions of Test: World Climate and Climate Change- Graph Based Type Questions questions in English are available as part of our Geography Class 11 for Humanities/Arts & Test: World Climate and Climate Change- Graph Based Type Questions solutions in Hindi for Geography Class 11 course. Download more important topics, notes, lectures and mock test series for Humanities/Arts Exam by signing up for free. Attempt Test: World Climate and Climate Change- Graph Based Type Questions | 12 questions in 24 minutes | Mock test for Humanities/Arts preparation | Free important questions MCQ to study Geography Class 11 for Humanities/Arts Exam | Download free PDF with solutions
Test: World Climate and Climate Change- Graph Based Type Questions - Question 1

Direction: Read the Case Study given below and answer any three of the questions that follow:
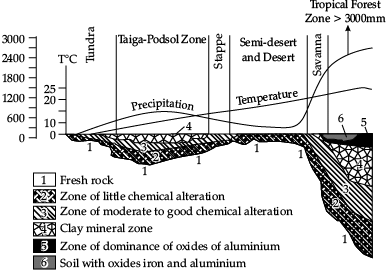
Q. According to the graph the precipitation is highest in which of the following forest zone?

Detailed Solution for Test: World Climate and Climate Change- Graph Based Type Questions - Question 1
The precipitation is highest in the Tropical forest zone.

Tropical rainforests are mainly located between the latitudes of 23.5°N (the Tropic of Cancer) and 23.5°S (the Tropic of Capricorn)—the tropics. Tropical rainforests are found in Central and South America, western and central Africa, western India, Southeast Asia, the island of New Guinea, and Australia.

Test: World Climate and Climate Change- Graph Based Type Questions - Question 2

Direction: Read the Case Study given below and answer any three of the questions that follow:

Q. Clay mineral zone is found in:

Detailed Solution for Test: World Climate and Climate Change- Graph Based Type Questions - Question 2
Clay mineral zone is found in Taiga.

The taiga is a forest of the cold, subarctic region. The subarctic is an area of the Northern Hemisphere that lies just south of the Arctic Circle. The taiga lies between the tundra to the north and temperate forests to the south. The soil beneath the taiga often contains permafrost—a layer of permanently frozen soil.

1 Crore+ students have signed up on EduRev. Have you? Download the App
Test: World Climate and Climate Change- Graph Based Type Questions - Question 3

Direction: Read the Case Study given below and answer any three of the questions that follow:
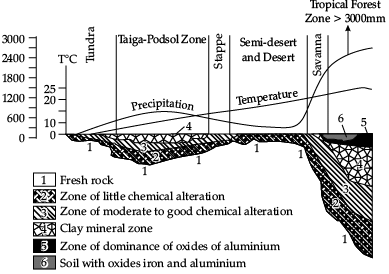
Q. According to the graph which of the following forest zone has the highest temperature?

Detailed Solution for Test: World Climate and Climate Change- Graph Based Type Questions - Question 3
According to the graph Tropical forest zone has the highest temperature.

A tropical rainforest climate is typically hot, very humid and wet. The highest temperature ever recorded was 103 °F (39 °C) at San Lorenzo, while the lowest temperature ever recorded was 38 °F (3 °C) at Aibonito.

Test: World Climate and Climate Change- Graph Based Type Questions - Question 4

Direction: Read the Case Study given below and answer any three of the questions that follow:
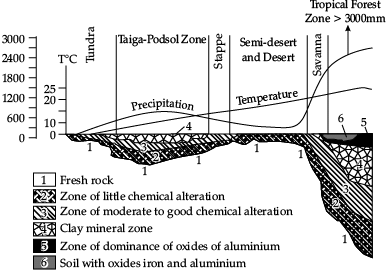
Q. According to the graph which of the following zone has zone of dominance of oxides of aluminium?

Detailed Solution for Test: World Climate and Climate Change- Graph Based Type Questions - Question 4
According to the graph Tropical zone has zone of dominance of oxides of aluminium.

Aluminum oxide is a white odorless crystalline powder. Aluminum oxide has a chemical formula Al2O3. It is amphoteric in nature, and is used in various chemical, industrial and commercial applications. It is considered an indirect additive used in food contact substances by the FDA.

Test: World Climate and Climate Change- Graph Based Type Questions - Question 5

Direction: Study the given graph carefully on rise of temperature globally and answer any three of the following questions:
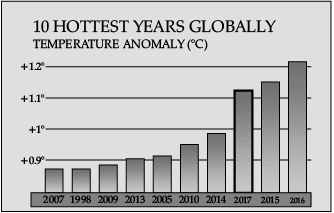
Q. In which years the temperatures increased by +0.9°C?
Detailed Solution for Test: World Climate and Climate Change- Graph Based Type Questions - Question 5
During 2007, 1998 and 2009 temperatures increased by +0.9°C.
Test: World Climate and Climate Change- Graph Based Type Questions - Question 6

Direction: Study the given graph carefully on rise of temperature globally and answer any three of the following questions:
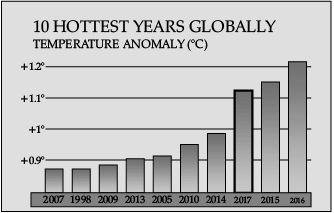
Q. The temperature rose _______ globally by 2016.
Detailed Solution for Test: World Climate and Climate Change- Graph Based Type Questions - Question 6
The temperature rose More than +1.2°C globally by 2016.
Test: World Climate and Climate Change- Graph Based Type Questions - Question 7

Direction: Study the given graph carefully on rise of temperature globally and answer any three of the following questions:
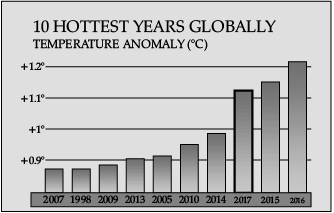
Q. Which was the last year of the 20th century to experience increase in temperature by +1°C?
Detailed Solution for Test: World Climate and Climate Change- Graph Based Type Questions - Question 7
1998 was the last year of the 20th century to experience increase in temperature by +1°C.
Test: World Climate and Climate Change- Graph Based Type Questions - Question 8

Direction: Study the given graph carefully on rise of temperature globally and answer any three of the following questions:
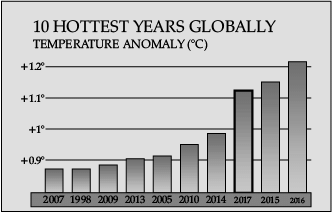
Q. How much did the temperature rise by 2017?
Detailed Solution for Test: World Climate and Climate Change- Graph Based Type Questions - Question 8
Temperature raised by More than +1.1°C in 2017.
Test: World Climate and Climate Change- Graph Based Type Questions - Question 9

Direction: Study the given graph on global greenhouse gas emission and answer any three of the following questions:
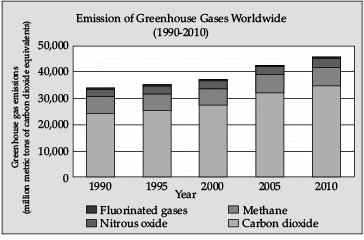
Q. Which gas had the maximum emission in 2010?
Detailed Solution for Test: World Climate and Climate Change- Graph Based Type Questions - Question 9
Carbon dioxide had the maximum emission in 2010.

Carbon dioxide emissions or CO2 emissions are emissions stemming from the burning of fossil fuels and the manufacture of cement; they include carbon dioxide produced during consumption of solid, liquid, and gas fuels as well as gas flaring.

Test: World Climate and Climate Change- Graph Based Type Questions - Question 10

Direction: Study the given graph on global greenhouse gas emission and answer any three of the following questions:
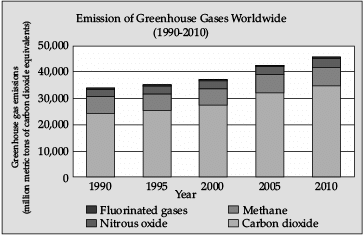
Q. How much Nitrous Oxide was emitted in 1990?
Detailed Solution for Test: World Climate and Climate Change- Graph Based Type Questions - Question 10
Nitrous Oxide was emitted between 30,000 to 35,000 tons in 1990.

Nitrous oxide is emitted when fuels are burned. The amount of N2O emitted from burning fuels depends on the type of fuel and combustion technology, maintenance, and operating practices.

Test: World Climate and Climate Change- Graph Based Type Questions - Question 11

Direction: Study the given graph on global greenhouse gas emission and answer any three of the following questions:
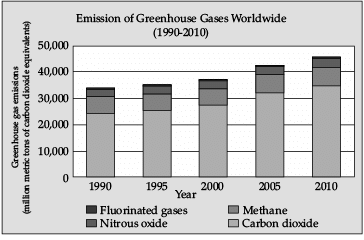
Q. Which gas had the minimum emission in 1990?
Detailed Solution for Test: World Climate and Climate Change- Graph Based Type Questions - Question 11
Fluorinated gases had the minimum emission in 1990.

Fluorinated gases (F-gases) are man-made gases that can stay in the atmosphere for centuries and contribute to a global greenhouse effect. F-gases are a subgroup of the halogenated gases, the majority of which are halocarbons that include fluorine, but do not include chlorine, bromine, or iodine.

Test: World Climate and Climate Change- Graph Based Type Questions - Question 12

Direction: Study the given graph on global greenhouse gas emission and answer any three of the following questions:
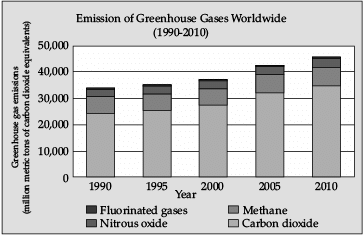
Q. How much Methane was emitted in 2005?
Detailed Solution for Test: World Climate and Climate Change- Graph Based Type Questions - Question 12
Methane was emitted between 30,000-40,000 metric tons in 2005.

Methane is a powerful greenhouse gas emitted by human activities such as leakage from natural gas systems and the raising of livestock, as well as by natural sources such as wetlands. Methane is a short-lived climate pollutant with an atmospheric lifetime of around 12 years.

71 videos|245 docs|44 tests
Information about Test: World Climate and Climate Change- Graph Based Type Questions Page
In this test you can find the Exam questions for Test: World Climate and Climate Change- Graph Based Type Questions solved & explained in the simplest way possible. Besides giving Questions and answers for Test: World Climate and Climate Change- Graph Based Type Questions, EduRev gives you an ample number of Online tests for practice

Top Courses for Humanities/Arts

71 videos|245 docs|44 tests
Download as PDF

Top Courses for Humanities/Arts