Bar Chart - Practice Test (With Solutions) CAT, Common Admission Test - LR MCQ
13 Questions MCQ Test - Bar Chart - Practice Test (With Solutions) CAT, Common Admission Test

The following bar chart shows the monthly expenditure of a family comprising of five persons over a period of seven months during three different years.
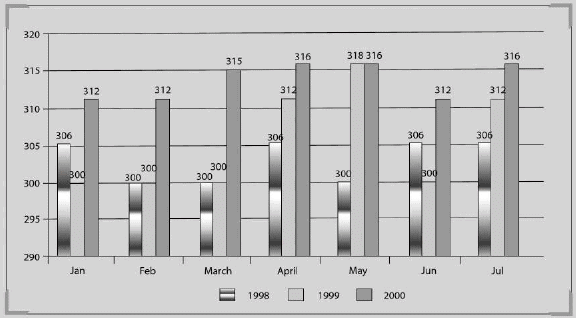
What is the average monthly expenditure of the whole family in the year 2000?
The following bar chart shows the monthly expenditure of a family comprising of five persons over a period of seven months during three different years.
Which months have NOT shown the same change in trend across all the given three years?

For how many months of the given years the expenditure has been consistently increasing or decreasing?
Refer to the following bar graph and solve the based on it.
The bar chart given below represents top 10 exporters and their export value (in billion $) in 2008.
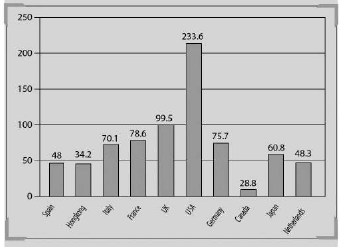
If India also joins the top ten exporters list by becoming the 11th largest exporter, then what will be the effect on the average exports of these 11 countries; provided the export value of India is $ 10 billion?
Refer to the following bar graph and solve the based on it.
The bar chart given below represents top 10 exporters and their export value (in billion $) in 2008.
What is the average export of all the countries in billion dollars for the year 2008?
Refer to the following bar graph and solve the based on it.
The bar chart given below represents top 10 exporters and their export value (in billion $) in 2008.
If the average export of the top ten exporters is calculated how many of the top ten exporting countries have higher export than this average?
Refer to the following bar graph end solve the questions based on it.
Amount of production and sales by a company over the years (in lacs tonnes)
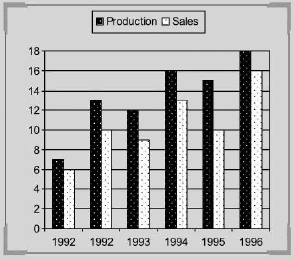
What is the difference between the sales of 1993 and 1995 (in thousand tonnes)?
Refer to the following bar graph end solve the questions based on it.
Amount of production and sales by a company over the years (in lacs tonnes)
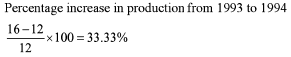
What is the approximate percentage increase in production from 1993 to 1994?
Refer to the following bar graph end solve the questions based on it.
Amount of production and sales by a company over the years (in lacs tonnes)
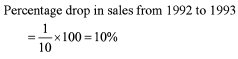
What is the percentage drop in sales from 1992 to 1993?
Refer to the following bar graph and solve the questions based on it.
The following bar chart gives the cumulative percentage of five different types of bikes produced by Kajaj during tiie given two years: Total Bikes produced in 2006 is 4,50,000
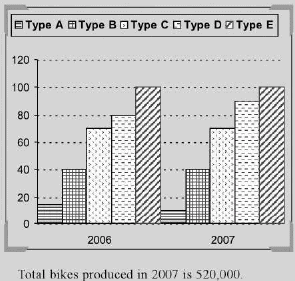
If 85% of the E type bikes produced during 2006 and 2007 are being sold by the company, then how many E type bikes are left unsold?
Refer to the following bar graph and solve the questions based on it.
The following bar chart gives the cumulative percentage of five different types of bikes produced by Kajaj during tiie given two years: Total Bikes produced in 2006 is 4,50,000
Production of B type bikes in 2007 is what percentage of bikes produced in 2006?
Refer to the following bar graph and solve the based on it.
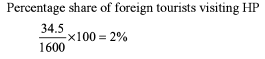
The bar graph given below shows the five districts of the state of Himachal Pradesh and the number of tourists visiting them. For the given bar chart, total number of Indian tourists is more that the total number of foreign tourists. None of the tourists can be Indian as w^ell as foreigner.
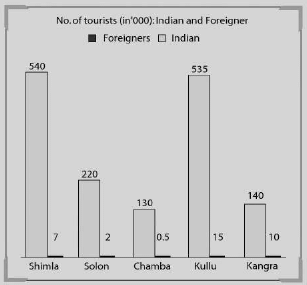
Approximately what percentage of the total tourists visiting Himachal Pradesh are foreigners?
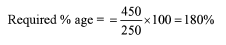
Refer to the following bar graph and solve the questions based on it, The following bar charts represents the value of exports and imports (in Rs crores) of n country for the given period
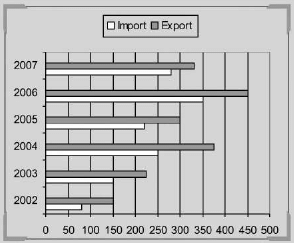
(All the values in the above bar chart are the multiples of 10).
The value of exports in 2006 was what percentage of the average value of imports in the years 2004, 2005 and 2007?


Important Questions for Bar Chart - Practice Test (With Solutions) CAT, Common Admission Test
Bar Chart - Practice Test (With Solutions) CAT, Common Admission Test MCQs with Answers
Online Tests for Bar Chart - Practice Test (With Solutions) CAT, Common Admission Test
|
© EduRev
|
Education Revolution
|


|


