IIFT Data Interpretation MCQ Quiz - 1 - CAT MCQ
18 Questions MCQ Test - IIFT Data Interpretation MCQ Quiz - 1
Group Question
Answer the following question based on the information given below.
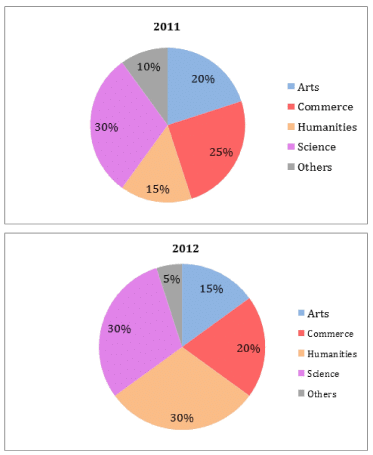
The two pie-charts below provide information about the background-wise batch distribution of a B-school class in 2011 and 2012. The total number of students from the Arts background increased by 25% in 2012 as compared to 2011. (Assume that the total number of students to be 300 in the year 2011)

Q. How many more students were there from the Humanities background in 2012 as compared to 2011 ?
The two pie-charts below provide information about the background-wise batch distribution of a B-school class in 2011 and 2012. The total number of students from the Arts background increased by 25% in 2012 as compared to 2011. (Assume that the total number of students to be 300 in the year 2011)
The two pie-charts below provide information about the background-wise batch distribution of a B-school class in 2011 and 2012. The total number of students from the Arts background increased by 25% in 2012 as compared to 2011. (Assume that the total number of students to be 300 in the year 2011)

Q. What was the percentage increase in the number of students from the Science background in 2012 as compared to 2011 ?
| 1 Crore+ students have signed up on EduRev. Have you? Download the App |
Group Question
Answer the following question based on the information given below.
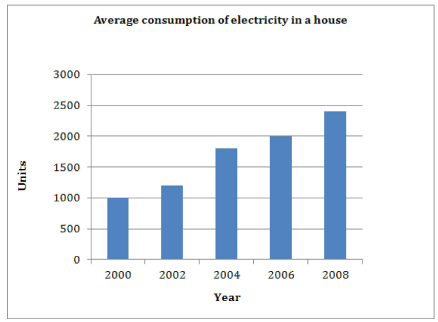
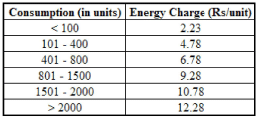
The bar graph below shows the average electricity consumption in a house in all alternate years from 2000 to 2008. The payable amount for a particular year comprises the billed amount and 12.36% service tax. The service tax is calculated on the billed amount. The billed amount is calculated solely on the number of units consumed, and the units are billed as per various slabs (as shown in the table). For instance, if a household has consumed 420 units in a year, the first 100 units are charged at Rs. 2.23/unit, the next 300 emits are charged at Rs. 4.78/unit and the final 20 emits are charged at Rs. 6.78/unit.


Q. What is the payable amount for this household in 2006?
The bar graph below shows the average electricity consumption in a house in all alternate years from 2000 to 2008. The payable amount for a particular year comprises the billed amount and 12.36% service tax. The service tax is calculated on the billed amount. The billed amount is calculated solely on the number of units consumed, and the units are billed as per various slabs (as shown in the table). For instance, if a household has consumed 420 units in a year, the first 100 units are charged at Rs. 2.23/unit, the next 300 emits are charged at Rs. 4.78/unit and the final 20 emits are charged at Rs. 6.78/unit.
The bar graph below shows the average electricity consumption in a house in all alternate years from 2000 to 2008. The payable amount for a particular year comprises the billed amount and 12.36% service tax. The service tax is calculated on the billed amount. The billed amount is calculated solely on the number of units consumed, and the units are billed as per various slabs (as shown in the table). For instance, if a household has consumed 420 units in a year, the first 100 units are charged at Rs. 2.23/unit, the next 300 emits are charged at Rs. 4.78/unit and the final 20 emits are charged at Rs. 6.78/unit.
Q. By what amount does the payable amount for 2004 exceed the payable amount for 2002?
The bar graph below shows the average electricity consumption in a house in all alternate years from 2000 to 2008. The payable amount for a particular year comprises the billed amount and 12.36% service tax. The service tax is calculated on the billed amount. The billed amount is calculated solely on the number of units consumed, and the units are billed as per various slabs (as shown in the table). For instance, if a household has consumed 420 units in a year, the first 100 units are charged at Rs. 2.23/unit, the next 300 emits are charged at Rs. 4.78/unit and the final 20 emits are charged at Rs. 6.78/unit.
Q. How much service tax has the household paid in all over the given period?
Group Question
Answer the following question based on the information given below.
The table below shows the number of male and female voters in eight constituencies of a state from 2012 to 2014.
Q. In how many constituencies is the compound annual growth rate (CAGR) of male voters less than that of the female voters?
The table below shows the number of male and female voters in eight constituencies of a state from 2012 to 2014.
Q. Which constituency witnessed the highest percentage growth in the total number of voters, over the given period?
The table below shows the number of male and female voters in eight constituencies of a state from 2012 to 2014.
Q. In which constituency is the CAGR of total voters the least over the given period?
Group Question
Answer the following question based on the information given below.
Year-wise break-up of number of educational institutions in India:
Q. Which of the following year has seen the maximum percentage growth of Upper primary schools over the previous year?
Year-wise break-up of number of educational institutions in India:
Q. Which of the following statements is definitely true?
Year-wise break-up of number of educational institutions in India:
Q. Which of the following statement(s) is/are definitely true?
Year-wise break-up of number of educational institutions in India:
Q. What is the number of years in which the total number of Upper primary schools and Junior colleges is less than half of the number of Primary schools?
Year-wise break-up of number of educational institutions in India:
Q. If in the year 2005-06, the number of Upper primary schools grows by the highest percentage growth recorded in the last 6 years (for Upper primary schools), then what is the expected number of Upper primary schools in 2005-06?
Group Question
Answer the following question based on the information given below.
The table below shows production area, production quantity, export quantity, import quantity, export and import value of dry fruits over the period of five years in a country. The production is consumed in two ways - export and domestic consumption.
The export and import values in crores are in the local currency of the country.
Q. Approximately, what percentage of domestic consumption are imports of dry fruits during 2005-2006?
The table below shows production area, production quantity, export quantity, import quantity, export and import value of dry fruits over the period of five years in a country. The production is consumed in two ways - export and domestic consumption.
The export and import values in crores are in the local currency of the country.
Q. What is the value of exports in 2008-09 in millions of US dollars, considering the same foreign exchange value as imports in that year?
The table below shows production area, production quantity, export quantity, import quantity, export and import value of dry fruits over the period of five years in a country. The production is consumed in two ways - export and domestic consumption.
The export and import values in crores are in the local currency of the country.
Q. Which of the following statements is true?
The table below shows production area, production quantity, export quantity, import quantity, export and import value of dry fruits over the period of five years in a country.The production is consumed in two ways - export and domestic consumption.
The export and import values in crores are in the local currency of the country.
Q. Which of the following statements is false?


