IIFT Data Interpretation MCQ Quiz - 2 - CAT MCQ
18 Questions MCQ Test - IIFT Data Interpretation MCQ Quiz - 2
Group Question
Answer the following question based on the information given below.
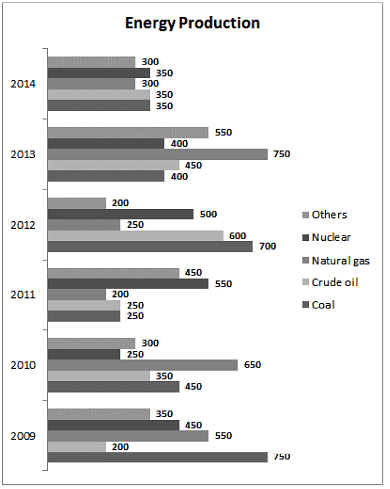
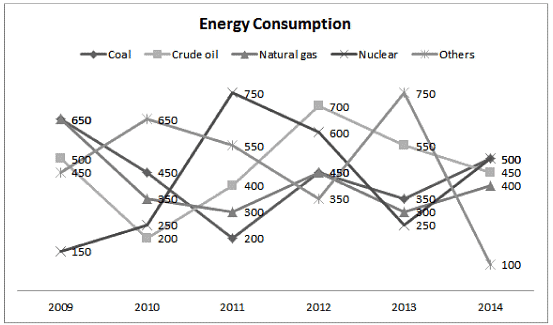
Analyze the charts given below that show the energy consumption and energy production of XYZ country from various sources. The difference in production and consumption of energy from any source is bridged through external trade (i.e. export or import) of energy from the same source. All the values are given in Terawatt-hours (Twh).


Q. Which year registered the highest external trade in the energy sector?
Answer the following question based on the information given below.
Analyze the charts given below that show the energy consumption and energy production of XYZ country from various sources. The difference in production and consumption of energy from any source is bridged through external trade (i.e. export or import) of energy from the same source. All the values are given in Terawatt-hours (Twh).


Q. In which year are the net imports of all the categories taken together the lowest?
| 1 Crore+ students have signed up on EduRev. Have you? Download the App |
Analyze the charts given below that show the energy consumption and energy production of XYZ country from various sources. The difference in production and consumption of energy from any source is bridged through external trade (i.e. export or import) of energy from the same source. All the values are given in Terawatt-hours (Twh).


Q. Which of the following statement(s) is/are true?
I. In each year, net exports are always less than the external trade.
II. Coal is always exported.
III. Net import of energy from at least one source is nil from 2009-2014.
I. In each year, net exports are always less than the external trade.
II. Coal is always exported.
III. Net import of energy from at least one source is nil from 2009-2014.
Group Question
Answer the following question based on the information given below.
Eight friends Raju, Ravi, Ramesh, Rahul, Arjun, Arvind, Anish and Atul are skilled at making Handicraft items. In order to make money using their skills, they decide to make a certain number of handicraft items and sell them at a Handicraft Expo. They decided to minimize time and maximize their productivity by forming two groups. The people whose names start with the letter ‘R’ form Group 1 and the people whose names start with the letter ‘A’ form Group 2. Each person from Group 1 forms a team each person from Group 2 to produce a certain number of handicraft items of a particular type, the details of which are given in the tables below.
Table 1 gives details of the type of handicraft item produced by each team.
Table 2 gives details of the number of handicraft items produced by each team.
Table 3 gives the cost price and selling price of one item of each type
The money (Cost Price and Profit) is shared according to the number of items each one has worked on. For example, if Rahul and Arvind made 175 pots, the total cost price and the profit made by selling those pots would be shared equally.
Q. Who has worked on the maximum number of handicraft items?
Eight friends Raju, Ravi, Ramesh, Rahul, Arjun, Arvind, Anish and Atul are skilled at making Handicraft items. In order to make money using their skills, they decide to make a certain number of handicraft items and sell them at a Handicraft Expo. They decided to minimize time and maximize their productivity by forming two groups. The people whose names start with the letter ‘R’ form Group 1 and the people whose names start with the letter ‘A’ form Group 2. Each person from Group 1 forms a team each person from Group 2 to produce a certain number of handicraft items of a particular type, the details of which are given in the tables below.
Table 1 gives details of the type of handicraft item produced by each team.
Table 2 gives details of the number of handicraft items produced by each team.
Table 3 gives the cost price and selling price of one item of each type
The money (Cost Price and Profit) is shared according to the number of items each one has worked on. For example, if Rahul and Arvind made 175 pots, the total cost price and the profit made by selling those pots would be shared equally.
Q. For how many teams was the total selling price more than Rs. 15,000?
Eight friends Raju, Ravi, Ramesh, Rahul, Arjun, Arvind, Anish and Atul are skilled at making Handicraft items. In order to make money using their skills, they decide to make a certain number of handicraft items and sell them at a Handicraft Expo. They decided to minimize time and maximize their productivity by forming two groups. The people whose names start with the letter ‘R’ form Group 1 and the people whose names start with the letter ‘A’ form Group 2. Each person from Group 1 forms a team each person from Group 2 to produce a certain number of handicraft items of a particular type, the details of which are given in the tables below.
Table 1 gives details of the type of handicraft item produced by each team.
Table 2 gives details of the number of handicraft items produced by each team.
Table 3 gives the cost price and selling price of one item of each type
The money (Cost Price and Profit) is shared according to the number of items each one has worked on. For example, if Rahul and Arvind made 175 pots, the total cost price and the profit made by selling those pots would be shared equally.
Q. For how many teams was the ratio of the total cost price to the total selling price less than 0.5?
Eight friends Raju, Ravi, Ramesh, Rahul, Arjun, Arvind, Anish and Atul are skilled at making Handicraft items. In order to make money using their skills, they decide to make a certain number of handicraft items and sell them at a Handicraft Expo. They decided to minimize time and maximize their productivity by forming two groups. The people whose names start with the letter ‘R’ form Group 1 and the people whose names start with the letter ‘A’ form Group 2. Each person from Group 1 forms a team each person from Group 2 to produce a certain number of handicraft items of a particular type, the details of which are given in the tables below.
Table 1 gives details of the type of handicraft item produced by each team.
Table 2 gives details of the number of handicraft items produced by each team.
Table 3 gives the cost price and selling price of one item of each type
The money (Cost Price and Profit) is shared according to the number of items each one has worked on. For example, if Rahul and Arvind made 175 pots, the total cost price and the profit made by selling those pots would be shared equally.
Q. Which of the following statement(s) is/are true?
I. The total profit earned by Atul is Rs. 6,000
II. The total selling price of all the items that Ramesh has worked on is Rs. 32,125
III. The team of Raju and Arjun had the lowest total selling price of the items they had produced.
Eight friends Raju, Ravi, Ramesh, Rahul, Arjun, Arvind, Anish and Atul are skilled at making Handicraft items. In order to make money using their skills, they decide to make a certain number of handicraft items and sell them at a Handicraft Expo. They decided to minimize time and maximize their productivity by forming two groups. The people whose names start with the letter ‘R’ form Group 1 and the people whose names start with the letter ‘A’ form Group 2. Each person from Group 1 forms a team each person from Group 2 to produce a certain number of handicraft items of a particular type, the details of which are given in the tables below.
Table 1 gives details of the type of handicraft item produced by each team.
Table 2 gives details of the number of handicraft items produced by each team.
Table 3 gives the cost price and selling price of one item of each type
The money (Cost Price and Profit) is shared according to the number of items each one has worked on. For example, if Rahul and Arvind made 175 pots, the total cost price and the profit made by selling those pots would be shared equally.
Q. For which type of handicraft was the total number of items 1Marks produced the highest?
Group Question
Answer the following question based on the information given below.
Year-wise break-up of number of educational institutions in India:
Q. Which of the following year has seen the maximum percentage growth of Upper primary schools over the previous year?
Year-wise break-up of number of educational institutions in India:
Q. Which of the following statements is definitely true?
Year-wise break-up of number of educational institutions in India:
Q. Which of the following statement(s) is/are definitely true?
Year-wise break-up of number of educational institutions in India:
Q. What is the number of years in which the total number of Upper primary schools and Junior colleges is less than half of the number of Primary schools?
Year-wise break-up of number of educational institutions in India:
Q. If in the year 2005-06, the number of Upper primary schools grows by the highest percentage growth recorded in the last 6 years (for Upper primary schools), then what is the expected number of Upper primary schools in 2005-06?
Group Question
Answer the following question based on the information given below.
The table below shows production area, production quantity, export quantity, import quantity, export and import value of dry fruits over the period of five years in a country.
The production is consumed in two ways - export and domestic consumption.
The export and import values in crores are in the local currency of the country.
Q. Approximately, what percentage of domestic consumption are imports of dry fruits during 2005-2006?
The table below shows production area, production quantity, export quantity, import quantity, export and import value of dry fruits over the period of five years in a country.
The production is consumed in two ways - export and domestic consumption.
The export and import values in crores are in the local currency of the country.
Q. What is the value of exports in 2008-09 in millions of US dollars, considering the same foreign exchange value as imports in that year?
The table below shows production area, production quantity, export quantity, import quantity, export and import value of dry fruits over the period of five years in a country.
The production is consumed in two ways - export and domestic consumption.
The export and import values in crores are in the local currency of the country.
Q. Which of the following statements is true?
The table below shows production area, production quantity, export quantity, import quantity, export and import value of dry fruits over the period of five years in a country.
The production is consumed in two ways - export and domestic consumption.
The export and import values in crores are in the local currency of the country.
Q. Which of the following statements is false?


