IIFT Data Interpretation MCQ Quiz - 3 - CAT MCQ
18 Questions MCQ Test - IIFT Data Interpretation MCQ Quiz - 3
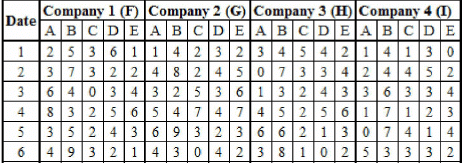
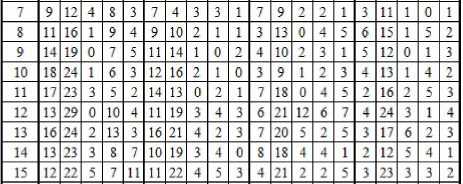
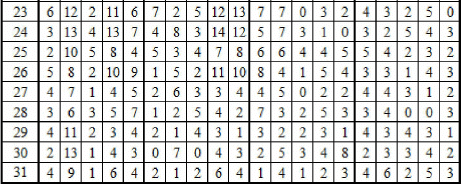
The table below shows the monthly sales of cars of four different companies in May 2009. Each company produces 5 different models of cars A, B, C, D and E. Cars of any two companies are not the same. For example Model A of F is not the same as that of Model A of G.


Q.
Which of the following statements is true?
The table below shows the monthly sales of cars of four different companies in May 2009. Each company produces 5 different models of cars A, B, C, D and E. Cars of any two companies are not the same. For example Model A of F is not the same as that of Model A of G.


Q.
Which of the following statements is true?
The table below shows the monthly sales of cars of four different companies in May 2009. Each company produces 5 different models of cars A, B, C, D and E. Cars of any two companies are not the same. For example Model A of F is not the same as that of Model A of G.


Q.
How many instances are there where the sales of a model of any company for two consecutive days is the same?
The table below shows the monthly sales of cars of four different companies in May 2009. Each company produces 5 different models of cars A, B, C, D and E. Cars of any two companies are not the same. For example Model A of F is not the same as that of Model A of G.
Q.
Best day of sales is defined as the day on which the total sales for all the models of all the companies together is highest. Which of the following days was the best day of sales for all the models of all the companies in the month of May 2009?
The table below shows the monthly sales of cars of four different companies in May 2009. Each company produces 5 different models of cars A, B, C, D and E. Cars of any two companies are not the same. For example Model A of F is not the same as that of Model A of G.
Q.
Which of the following statements is false?
A drug peddler operated from four different locations to avoid the local police traps. He had named these places as Tea Stall, Coffee Stall, Milk Stall and Juice Stall. This drug peddler dealt in six different types of drugs: Cocaine, Heroin, Opium, Marijuana, Morphine and Darvon. To camouflage his operations he sold these drugs in pre-packed envelopes. Further to facilitate his operations he had got all of these drugs packed according to the order size. The different envelopes he used to denote different sizes were known as Chota, Medium, Bada, Vazir, and Badshah. Each of the drugs was available in all the sizes of envelopes.
However an intelligent officer, Karamchand from Narcotics department received certain pieces of information from one of his sources, Lily. Before raiding on to the premises Karamchand decided to completely analyze the piece of information he had with him.
The first chart gave the details of the number of envelopes mentioned as a percentage of the total number of envelopes.
His second source, Liliput gave him additional information that the number of Vazir envelopes, as a percentage of total number of envelopes in each of the location, is not more than 1% in Coffee and Milk stall.
His third source, Parma opined that all the envelopes containing one or the other of the three drugs - Cocaine, Heroin and Darvon - were only in one or the other of the three envelopes - Chota, Medium or Bada.
Q.
If the information from the 1st and 2nd source is considered, then what could be the minimum percentage of Vazir envelopes as compared to the total number of envelopes, which Karamchand could expect in Tea stall?
A drug peddler operated from four different locations to avoid the local police traps. He had named these places as Tea Stall, Coffee Stall, Milk Stall and Juice Stall. This drug peddler dealt in six different types of drugs: Cocaine, Heroin, Opium, Marijuana, Morphine and Darvon. To camouflage his operations he sold these drugs in pre-packed envelopes. Further to facilitate his operations he had got all of these drugs packed according to the order size. The different envelopes he used to denote different sizes were known as Chota, Medium, Bada, Vazir, and Badshah. Each of the drugs was available in all the sizes of envelopes.
However an intelligent officer, Karamchand from Narcotics department received certain pieces of information from one of his sources, Lily. Before raiding on to the premises Karamchand decided to completely analyze the piece of information he had with him.
The first chart gave the details of the number of envelopes mentioned as a percentage of the total number of envelopes.
His second source, Liliput gave him additional information that the number of Vazir envelopes, as a percentage of total number of envelopes in each of the location, is not more than 1% in Coffee and Milk stall.
His third source, Parma opined that all the envelopes containing one or the other of the three drugs - Cocaine, Heroin and Darvon - were only in one or the other of the three envelopes - Chota, Medium or Bada.
Q.
if the ratio of Vazir envelopes in Tea Stall and Juice Stall was 2 : 7, then what could have been the difference in the number of envelopes other than Vazir envelopes in both these locations, assuming that information from the 1st and 2nd source is correct?
A drug peddler operated from four different locations to avoid the local police traps. He had named these places as Tea Stall, Coffee Stall, Milk Stall and Juice Stall. This drug peddler dealt in six different types of drugs: Cocaine, Heroin, Opium, Marijuana, Morphine and Darvon. To camouflage his operations he sold these drugs in pre-packed envelopes. Further to facilitate his operations he had got all of these drugs packed according to the order size. The different envelopes he used to denote different sizes were known as Chota, Medium, Bada, Vazir, and Badshah. Each of the drugs was available in all the sizes of envelopes.
However an intelligent officer, Karamchand from Narcotics department received certain pieces of information from one of his sources, Lily. Before raiding on to the premises Karamchand decided to completely analyze the piece of information he had with him.
The first chart gave the details of the number of envelopes mentioned as a percentage of the total number of envelopes.
His second source, Liliput gave him additional information that the number of Vazir envelopes, as a percentage of total number of envelopes in each of the location, is not more than 1% in Coffee and Milk stall.
His third source, Parma opined that all the envelopes containing one or the other of the three drugs - Cocaine, Heroin and Darvon - were only in one or the other of the three envelopes - Chota, Medium or Bada.
Q.
What could be the ratio of Chota, Medium and Bada envelopes containing the drugs Opium, Marijuana and Morphine in that order, if information from 1st and 3rd source is believed to be true?
A drug peddler operated from four different locations to avoid the local police traps. He had named these places as Tea Stall, Coffee Stall, Milk Stall and Juice Stall. This drug peddler dealt in six different types of drugs: Cocaine, Heroin, Opium, Marijuana, Morphine and Darvon. To camouflage his operations he sold these drugs in pre-packed envelopes. Further to facilitate his operations he had got all of these drugs packed according to the order size. The different envelopes he used to denote different sizes were known as Chota, Medium, Bada, Vazir, and Badshah. Each of the drugs was available in all the sizes of envelopes.
However an intelligent officer, Karamchand from Narcotics department received certain pieces of information from one of his sources, Lily. Before raiding on to the premises Karamchand decided to completely analyze the piece of information he had with him.
The first chart gave the details of the number of envelopes mentioned as a percentage of the total number of envelopes.
His second source, Liliput gave him additional information that the number of Vazir envelopes, as a percentage of total number of envelopes in each of the location, is not more than 1% in Coffee and Milk stall.
His third source, Parma opined that all the envelopes containing one or the other of the three drugs - Cocaine, Heroin and Darvon - were only in one or the other of the three envelopes - Chota, Medium or Bada.
Q.
f the Chota envelopes containing Opium, Marijuana and Morphine are the maximum possible, then the number of envelopes of Opium in Coffee Stall that are not Chota, Medium or Bada cannot be less than____
(Assume information from 1st and 3rd source to be true.)
A drug peddler operated from four different locations to avoid the local police traps. He had named these places as Tea Stall, Coffee Stall, Milk Stall and Juice Stall. This drug peddler dealt in six different types of drugs: Cocaine, Heroin, Opium, Marijuana, Morphine and Darvon. To camouflage his operations he sold these drugs in pre-packed envelopes. Further to facilitate his operations he had got all of these drugs packed according to the order size. The different envelopes he used to denote different sizes were known as Chota, Medium, Bada, Vazir, and Badshah. Each of the drugs was available in all the sizes of envelopes.
However an intelligent officer, Karamchand from Narcotics department received certain pieces of information from one of his sources, Lily. Before raiding on to the premises Karamchand decided to completely analyze the piece of information he had with him.
The first chart gave the details of the number of envelopes mentioned as a percentage of the total number of envelopes.
His second source, Liliput gave him additional information that the number of Vazir envelopes, as a percentage of total number of envelopes in each of the location, is not more than 1% in Coffee and Milk stall.
His third source, Parma opined that all the envelopes containing one or the other of the three drugs - Cocaine, Heroin and Darvon - were only in one or the other of the three envelopes - Chota, Medium or Bada.
Q.
The number of envelopes of how many of the mentioned drugs is less than the average number of envelopes per variety of the mentioned drugs?
A drug peddler operated from four different locations to avoid the local police traps. He had named these places as Tea Stall, Coffee Stall, Milk Stall and Juice Stall. This drug peddler dealt in six different types of drugs: Cocaine, Heroin, Opium, Marijuana, Morphine and Darvon. To camouflage his operations he sold these drugs in pre-packed envelopes. Further to facilitate his operations he had got all of these drugs packed according to the order size. The different envelopes he used to denote different sizes were known as Chota, Medium, Bada, Vazir, and Badshah. Each of the drugs was available in all the sizes of envelopes.
However an intelligent officer, Karamchand from Narcotics department received certain pieces of information from one of his sources, Lily. Before raiding on to the premises Karamchand decided to completely analyze the piece of information he had with him.
The first chart gave the details of the number of envelopes mentioned as a percentage of the total number of envelopes.
His second source, Liliput gave him additional information that the number of Vazir envelopes, as a percentage of total number of envelopes in each of the location, is not more than 1% in Coffee and Milk stall.
His third source, Parma opined that all the envelopes containing one or the other of the three drugs - Cocaine, Heroin and Darvon - were only in one or the other of the three envelopes - Chota, Medium or Bada.
Q.
What is the maximum possible number of Badshah envelopes at the Coffee stall?
Study the following pie charts regarding the sales of 5 models of motorcycles for the years 2011 and 2012 and answer the questions.
Q.
In 2011, sales of all models was 12,00,000 and it grew by 25% in 2012. What is the approximate increase in sales of number of motorcycles of brand B in 2012 over 2011?
Study the following pie charts regarding the sales of 5 models of motorcycles for the years 2011 and 2012 and answer the questions.
Q.
If total sales of all motorcycles is 12,00,000 in 2011 and it grew by 25% in 2012, what was the approximate percentage growth in sales of brands A and E together from 2011 to 2012?
The first table shows the number of saris (of eight colours) stocked in six regional showrooms. The second shows the number of saris (of all eight colours) sold in these six regional showrooms. The third table shows the percentage of saris sold to saris stocked for each colour in each region. The fourth table shows the percentage of saris of a specific colour sold within that region. The fifth table shows the percentage of saris of a specific colour sold across all the regions. Study the tables and for each of the following questions, choose the best alternative.
Which region-colour combination accounts for the highest percentage of sales to stock?
The first table shows the number of saris (of eight colours) stocked in six regional showrooms. The second shows the number of saris (of all eight colours) sold in these six regional showrooms. The third table shows the percentage of saris sold to saris stocked for each colour in each region. The fourth table shows the percentage of saris of a specific colour sold within that region. The fifth table shows the percentage of saris of a specific colour sold across all the regions. Study the tables and for each of the following questions, choose the best alternative.
Q.
Which colour is the most popular in region 1 ?
The first table shows the number of saris (of eight colours) stocked in six regional showrooms. The second shows the number of saris (of all eight colours) sold in these six regional showrooms. The third table shows the percentage of saris sold to saris stocked for each colour in each region. The fourth table shows the percentage of saris of a specific colour sold within that region. The fifth table shows the percentage of saris of a specific colour sold across all the regions. Study the tables and for each of the following questions, choose the best alternative.
Q.
Which region sold the maximum percentage of magenta saris out of the total sales of magenta saris?
The first table shows the number of saris (of eight colours) stocked in six regional showrooms. The second shows the number of saris (of all eight colours) sold in these six regional showrooms. The third table shows the percentage of saris sold to saris stocked for each colour in each region. The fourth table shows the percentage of saris of a specific colour sold within that region. The fifth table shows the percentage of saris of a specific colour sold across all the regions. Study the tables and for each of the following questions, choose the best alternative.
Q.
Out of the total regional sales, which region showed the minimum percentage of green sari sales?
The first table shows the number of saris (of eight colours) stocked in six regional showrooms. The second shows the number of saris (of all eight colours) sold in these six regional showrooms. The third table shows the percentage of saris sold to saris stocked for each colour in each region. The fourth table shows the percentage of saris of a specific colour sold within that region. The fifth table shows the percentage of saris of a specific colour sold across all the regions. Study the tables and for each of the following questions, choose the best alternative.
Q.
In which region is the maximum percentage of blue saris sold?


