MCQ Test: Pie Chart - 4 - Bank Exams MCQ
20 Questions MCQ Test Data Interpretation for Competitive Examinations - MCQ Test: Pie Chart - 4
Directions: Study the following pie-chart carefully and answer the questions given below:
Cost Estimated by a Family in Renovation of their House.
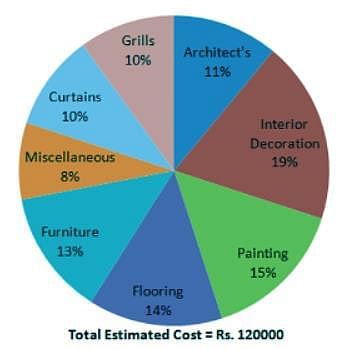
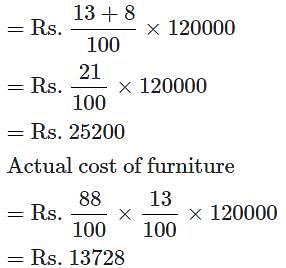
Q. Other than getting the discount of 12% on the estimated cost of furniture and actual miscellaneous expenditure being Rs. 10200 instead of the estimated one, the family's estimated cost is correct. What is the total amount spent by the family in renovating its house?
Cost Estimated by a Family in Renovation of their House.

Directions: Study the following pie-chart carefully and answer the questions given below:
Cost Estimated by a Family in Renovation of their House.

Q. The family gets a discount on furniture and pays 12% less than the estimated cost on furniture. What is the amount spent on furniture?
Cost Estimated by a Family in Renovation of their House.

Directions: Study the following pie-chart carefully and answer the questions given below:
Cost Estimated by a Family in Renovation of their House.

Q. What is the difference in the amount estimated by the family on interior decoration and that on architect’s fee?
Cost Estimated by a Family in Renovation of their House.

Directions: Study the following pie-chart carefully and answer the questions given below:
Cost Estimated by a Family in Renovation of their House.

Q. What is the cost estimated by the family on painting and flooring together?
Directions: Study the following pie-chart and the table given below it carefully to answer the questions given below:
Percentage-wise distribution of lecturers in 6 different subjects in a total number of lecturers: 1600.

Ratio of male to female lecturers

Q. What is the ratio of the number of female lecturers in Physics to the number of male lecturers in Mathematics?
Directions: Study the following pie-chart and the table given below it carefully to answer the questions given below:
Percentage-wise distribution of lecturers in 6 different subjects in a total number of lecturers: 1600.

Ratio of male to female lecturers

Q. What is the difference between the number of female lecturers in Zoology and the number of male lecturers in Hindi?
Directions: Study the following pie-chart and the table given below it carefully to answer the questions given below:
Percentage-wise distribution of lecturers in 6 different subjects in a total number of lecturers: 1600.

Ratio of male to female lecturers
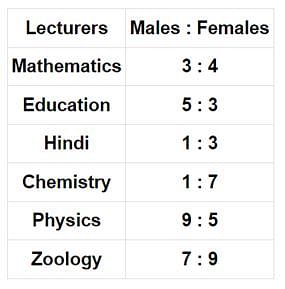
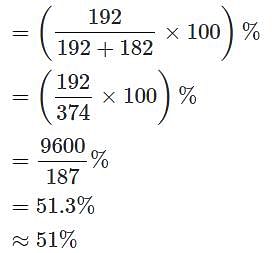
Q. Total number of lecturers (both male and female) in Hindi is approximately what percent of the total number of female lecturers in Mathematics and chemistry together?
Directions: Study the following pie-chart and the table given below it carefully to answer the questions given below:
Percentage-wise distribution of lecturers in 6 different subjects in a total number of lecturers: 1600.

Ratio of male to female lecturers

Q. What is the total number of male lecturers in the university?
Directions: Study the following pie-chart and the table given below it carefully to answer the questions given below:
Percentage-wise distribution of lecturers in 6 different subjects in a total number of lecturers: 1600.
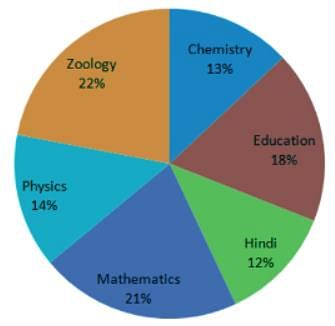
Ratio of male to female lecturers

Q. What is the difference between the total number of lecturers (both male and female) is Zoology and the total number of male lecturers in Chemistry and Education Together?
Directions: Refer to the pie-chart and answer the given questions.
Distribution of total number of Dell Laptops Sold by 5 Stores.

Distribution of number of Laptops (both Dell and Lenovo) Sold by 5 Stores in 2011.

Q. What is the central angle corresponding to number of Dell laptops sold by store S?
Directions: Refer to the pie-chart and answer the given questions.
Distribution of total number of Dell Laptops Sold by 5 Stores.

Distribution of number of Laptops (both Dell and Lenovo) Sold by 5 Stores in 2011.
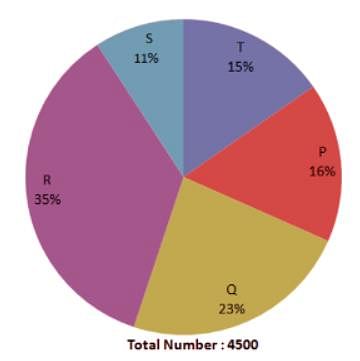
Q. What is the difference between number of laptops (both Dell and Lenovo) sold by store Q and total number of Lenovo laptops sold by store R and S together?
Directions: Refer to the pie-chart and answer the given questions.
Distribution of total number of Dell Laptops Sold by 5 Stores.

Distribution of number of Laptops (both Dell and Lenovo) Sold by 5 Stores in 2011.

Q. What is the average number of Dell Laptops sold by stores, P R and S together?
Directions: Refer to the pie-chart and answer the given questions.
Distribution of total number of Dell Laptops Sold by 5 Stores.

Distribution of number of Laptops (both Dell and Lenovo) Sold by 5 Stores in 2011.

Q. Number of Dell laptops sold by store T is what percent more than the number of laptops sold by store P?
Directions: Refer to the pie-chart and answer the given questions.
Distribution of total number of Dell Laptops Sold by 5 Stores.
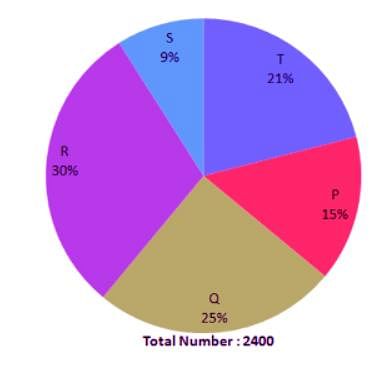
Distribution of number of Laptops (both Dell and Lenovo) Sold by 5 Stores in 2011.
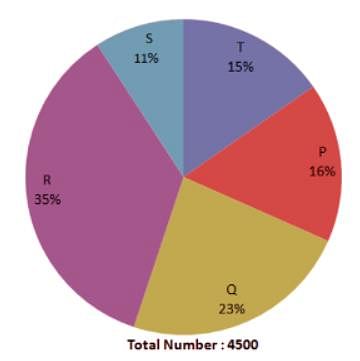
Q. Number of Dell laptops sold by store Q is approximately what percent of the number of the number of laptops (both Dell and Lenovo) sold by store R?
Directions: Study the pie chart and answer the given questions.
The total expenditure of a company for a particular month is Rs. 60000. The various heads of expenditure I to IV are indicated in a pie chart given below. These heads are:

Q. What is the amount spent on overhead expenses?
Directions: Study the pie chart and answer the given questions.
The total expenditure of a company for a particular month is Rs. 60000. The various heads of expenditure I to IV are indicated in a pie chart given below. These heads are:

Q. Total expenditure on conveyance is?
Directions: Study the pie chart and answer the given questions.
The total expenditure of a company for a particular month is Rs. 60000. The various heads of expenditure I to IV are indicated in a pie chart given below. These heads are:
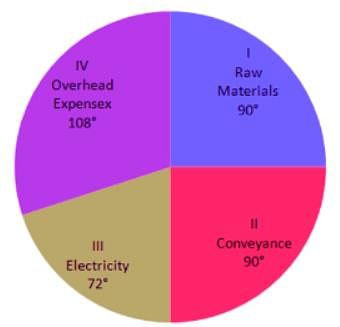
Q. What percentage of total expenditure is on raw materials?
Directions: Study the pie chart and answer the given questions.
The total expenditure of a company for a particular month is Rs. 60000. The various heads of expenditure I to IV are indicated in a pie chart given below. These heads are:

Q. What percentage of total expenditure is on electricity?
Directions: Based on the data given on the pie-chart. Solve the questions which follow :
Percentage Sales of different models of Computers in Kolkata in two different years. Given total sales in 1998 is 7890 and increase 16.5% in 1999.


Q. IBM's sales in 1998 is what percentage of the sales of Samsung in 1999?
Directions: Based on the data given on the pie-chart. Solve the questions which follow :
Percentage Sales of different models of Computers in Kolkata in two different years. Given total sales in 1998 is 7890 and increase 16.5% in 1999.
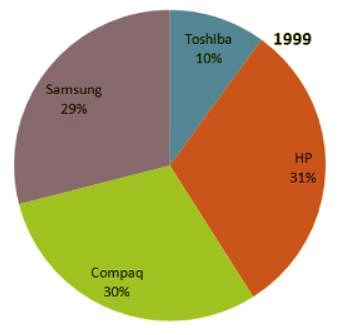

Q. For which brand of computers, did the sales increase the maximum in terms of absolute value between the two years?
|
17 videos|9 docs|42 tests
|
|
17 videos|9 docs|42 tests
|


