Bank Exams Exam  >  Bank Exams Tests  >  Data Interpretation for Competitive Examinations  >  MCQ Test: Tabular Graph - 1 - Bank Exams MCQ

MCQ Test: Tabular Graph - 1 - Bank Exams MCQ


Test Description

20 Questions MCQ Test Data Interpretation for Competitive Examinations - MCQ Test: Tabular Graph - 1

MCQ Test: Tabular Graph - 1 for Bank Exams 2025 is part of Data Interpretation for Competitive Examinations preparation. The MCQ Test: Tabular Graph - 1 questions and answers have been prepared according to the Bank Exams exam syllabus.The MCQ Test: Tabular Graph - 1 MCQs are made for Bank Exams 2025 Exam. Find important definitions, questions, notes, meanings, examples, exercises, MCQs and online tests for MCQ Test: Tabular Graph - 1 below.
Solutions of MCQ Test: Tabular Graph - 1 questions in English are available as part of our Data Interpretation for Competitive Examinations for Bank Exams & MCQ Test: Tabular Graph - 1 solutions in Hindi for Data Interpretation for Competitive Examinations course. Download more important topics, notes, lectures and mock test series for Bank Exams Exam by signing up for free. Attempt MCQ Test: Tabular Graph - 1 | 20 questions in 20 minutes | Mock test for Bank Exams preparation | Free important questions MCQ to study Data Interpretation for Competitive Examinations for Bank Exams Exam | Download free PDF with solutions
MCQ Test: Tabular Graph - 1 - Question 1

Study the following table and answer the questions.

Classification of 100 Students Based on the Marks Obtained by them in Physics and Chemistry in an Examination.
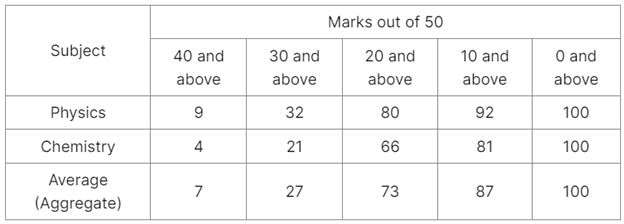
Q. What is the different between the number of students passed with 30 as cut-off marks in Chemistry and those passed with 30 as cut-off marks in aggregate?

Detailed Solution for MCQ Test: Tabular Graph - 1 - Question 1

Required difference
= (No. of students scoring 30 and above marks in Chemistry) - (Number of students scoring 30 and above marks in aggregate)
= 27 - 21
= 6.

MCQ Test: Tabular Graph - 1 - Question 2

Study the following table and answer the questions.

Classification of 100 Students Based on the Marks Obtained by them in Physics and Chemistry in an Examination.

Q. If it is known that at least 23 students were eligible for a Symposium on Chemistry, then the minimum qualifying marks in Chemistry for eligibility to Symposium would lie in the range?

Detailed Solution for MCQ Test: Tabular Graph - 1 - Question 2

Since 66 students get 20 and above marks in Chemistry and out of these 21 students get 30 and above marks, therefore to select top 35 students in Chemistry, the qualifying marks should lie in the range 20-30.

MCQ Test: Tabular Graph - 1 - Question 3

Study the following table and answer the questions.

Classification of 100 Students Based on the Marks Obtained by them in Physics and Chemistry in an Examination.

Q. If at least 60% marks in Physics are required for pursuing higher studies in Physics, how many students will be eligible to pursue higher studies in Physics?

Detailed Solution for MCQ Test: Tabular Graph - 1 - Question 3

We have 60% of 50 = 
∴ Required number
= No. of students scoring 30 and above marks in Physics
= 32

MCQ Test: Tabular Graph - 1 - Question 4

Study the following table and answer the questions.

Classification of 100 Students Based on the Marks Obtained by them in Physics and Chemistry in an Examination.

Q. The percentage of number of students getting at least 60% marks in Chemistry over those getting at least 40% marks in aggregate, is approximately?

Detailed Solution for MCQ Test: Tabular Graph - 1 - Question 4

Number of students getting at least 60% marks in Chemistry
= Number of students getting 30 and above marks in Chemistry
= 21.
Number of students getting at least 40% marks in aggregate
= Number of students getting 20 and above marks in aggregate
= 73.
Required percentage 
= 28.77%
≈ 29%.

MCQ Test: Tabular Graph - 1 - Question 5

Study the following table and answer the questions.

Classification of 100 Students Based on the Marks Obtained by them in Physics and Chemistry in an Examination.

Q. The number of students scoring less than 40% marks in aggregate is?

Detailed Solution for MCQ Test: Tabular Graph - 1 - Question 5

We have 40% of 50 

∴ Required number
= Number of students scoring less than 20 marks in aggregate
= 100 - Number of students scoring 20 and above marks in aggregate
= 100 - 73
= 27.

MCQ Test: Tabular Graph - 1 - Question 6

Directions: Study the given table carefully and answer the question that follow:
Number of candidates appeared and qualified for a test (in hundreds) in 6 different years from 5 different zones.
Note: Here App. means Appeared and Qual. Means qualified.
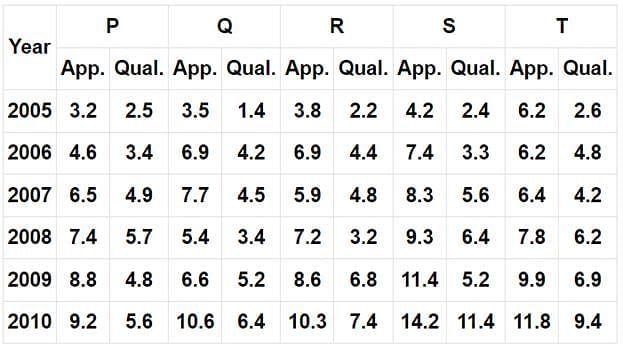
Q. What was the average number of candidates appeared from zone T over all the years together?

Detailed Solution for MCQ Test: Tabular Graph - 1 - Question 6

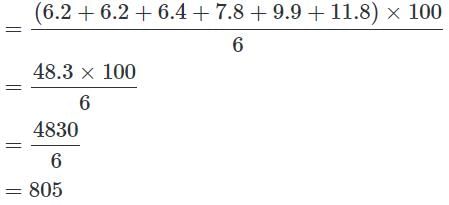
Average number of candidates appeared from T all over the years

MCQ Test: Tabular Graph - 1 - Question 7

Directions: Study the given table carefully and answer the question that follow:
Number of candidates appeared and qualified for a test (in hundreds) in 6 different years from 5 different zones.
Note: Here App. means Appeared and Qual. Means qualified.

Q. What was the ratio of the number of candidates appeared from zone P in the year 2005 to the number to the number of candidates qualified from zone S in the year 2007?

Detailed Solution for MCQ Test: Tabular Graph - 1 - Question 7

Required ratio
= 3.2/5.6
= 32/56
= 4/7
= 4 : 7

MCQ Test: Tabular Graph - 1 - Question 8

Directions: Study the given table carefully and answer the question that follow:
Number of candidates appeared and qualified for a test (in hundreds) in 6 different years from 5 different zones.
Note: Here App. means Appeared and Qual. Means qualified.

Q. In which years was in zones the different between the appeared candidates and qualified candidates the second lowest?

Detailed Solution for MCQ Test: Tabular Graph - 1 - Question 8

In zone S, the difference between the appeared candidates and the qualified candidates in various years is given below:
2005 → (4.2 - 2.4) = 1.8
2006 → (7.4 - 3.3) = 4.1
2007 → (8.3 - 5.6) = 2.7
2008 → (9.3 - 6.4) = 2.9
2009 → (11.4 - 5.2) = 6.2
2010 → (14.2 - 11.4) = 2.8
If was lowest in 2005 and second lowest in 2007

MCQ Test: Tabular Graph - 1 - Question 9

Directions: Study the given table carefully and answer the question that follow:
Number of candidates appeared and qualified for a test (in hundreds) in 6 different years from 5 different zones.
Note: Here App. means Appeared and Qual. Means qualified.

Q. The number of candidates who qualified the test from zone R in the year 2010 was approximately what percentage of the number of candidates who appeared from zone Q in the year 2008?

Detailed Solution for MCQ Test: Tabular Graph - 1 - Question 9

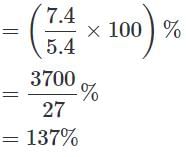
Required percentage

MCQ Test: Tabular Graph - 1 - Question 10

Directions: Study the given table carefully and answer the question that follow:
Number of candidates appeared and qualified for a test (in hundreds) in 6 different years from 5 different zones.
Note: Here App. means Appeared and Qual. Means qualified.

Q. From which zone was the total number of candidates who qualified the test, the second highest in the year?

Detailed Solution for MCQ Test: Tabular Graph - 1 - Question 10

Total number of candidates who qualified the test in 2009 and 2010 from various zones are:
P → (4.8 + 5.6) = 10.4
Q → (5.2 + 6.4) = 11.6
R → (6.8 + 7.4) = 14.2
S → (5.2 + 11.4) = 16.6
T → (6.9 + 9.4) = 16.3

MCQ Test: Tabular Graph - 1 - Question 11

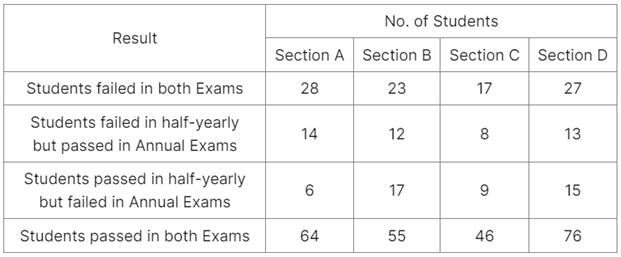
A school has four sections A, B, C, D of Class IX students.

The results of half yearly and annual examinations are shown in the table given below.
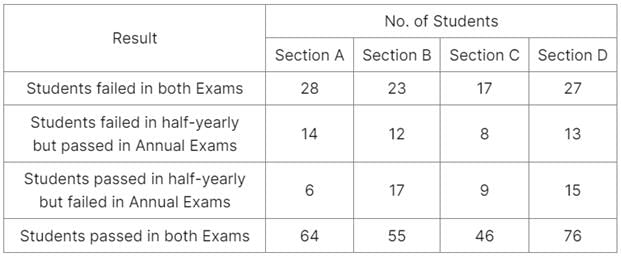
Q. If the number of students passing an examination be considered a criteria for comparision of difficulty level of two examinations, which of the following statements is true in this context?

Detailed Solution for MCQ Test: Tabular Graph - 1 - Question 11

Number of students who passed half-yearly exams in the school
= (Number of students passed in half-yearly but failed in annual exams) + (Number of students passed in both exams)
= (6 + 17 + 9 + 15) + (64 + 55 + 46 + 76)
= 288.
Also, Number of students who passed annual exams in the school
= (Number of students failed in half-yearly but passed in annual exams) + (Number of students passed in both exams)
= (14 + 12 + 8 + 13) + (64 + 55 + 46 + 76)
= 288.
Since, the number of students passed in half-yearly = the number of students passed in annual exams. Therefore, it can be inferred that both the examinations had almost the same difficulty level.
Thus Statements (a), (b) and (d) are false and Statement (c) is true.

MCQ Test: Tabular Graph - 1 - Question 12

A school has four sections A, B, C, D of Class IX students.

The results of half yearly and annual examinations are shown in the table given below.
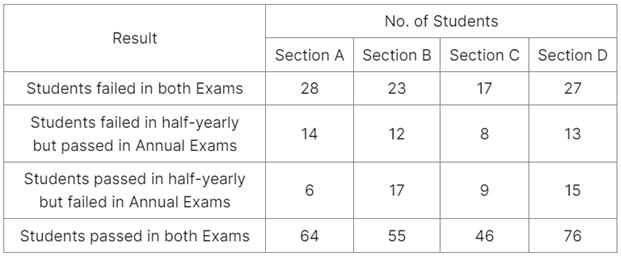
Q. Which section has the minimum failure rate in half yearly examination?

Detailed Solution for MCQ Test: Tabular Graph - 1 - Question 12

Total number of failures in half-yearly exams in a section = [(Number of students failed in both exams) + (Number of students failed in half-yearly but passed in Annual exams)] in that section
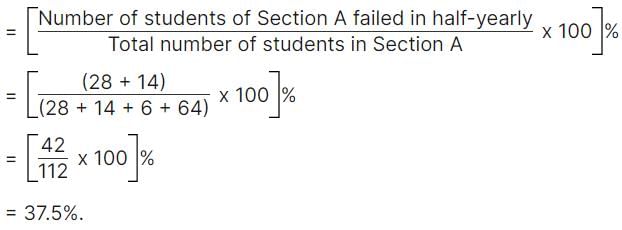
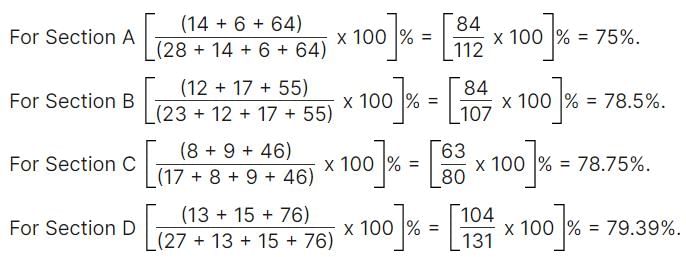
Therefore Failure rate in half-yearly exams in Section A

Similarly, failure rate in half-yearly exams in:

Clearly, the failure rate is minimum for Section D.

MCQ Test: Tabular Graph - 1 - Question 13

A school has four sections A, B, C, D of Class IX students.

The results of half yearly and annual examinations are shown in the table given below.
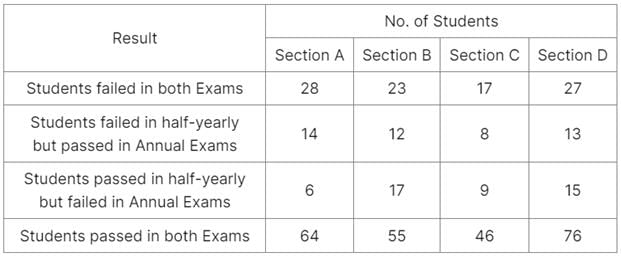
Q. How many students are there in Class IX in the school?

Detailed Solution for MCQ Test: Tabular Graph - 1 - Question 13

Since the classification of the students on the basis of their results and sections form independent groups, so the total number of students in the class:
= (28 + 23 + 17 + 27 + 14 + 12 + 8 + 13 + 6 + 17 + 9 + 15 + 64 + 55 + 46 + 76)
= 430.

MCQ Test: Tabular Graph - 1 - Question 14

A school has four sections A, B, C, D of Class IX students.

The results of half yearly and annual examinations are shown in the table given below.
Q. Which section has the maximum success rate in annual examination?

Detailed Solution for MCQ Test: Tabular Graph - 1 - Question 14

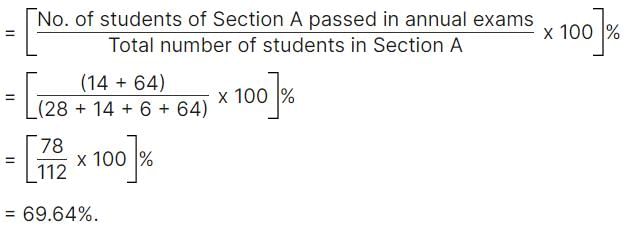
Total number of students passed in annual exams in a section = [(No. of students failed in half-yearly but passed in annual exams) + (No. of students passed in both exams)] in that section
∴ Success rate in annual exams in Section A

Similarly, success rate in annual exams in:

Clearly, the success rate in annual examination is maximum for Section A.

MCQ Test: Tabular Graph - 1 - Question 15

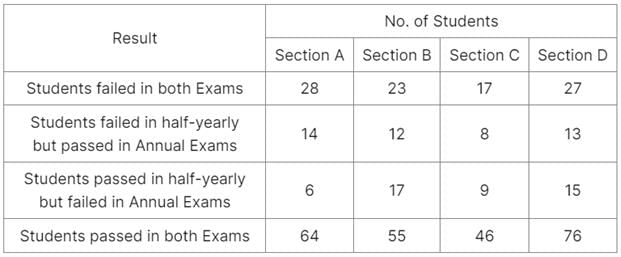
A school has four sections A, B, C, D of Class IX students.

The results of half yearly and annual examinations are shown in the table given below.
Q. Which section has the maximum pass percentage in at least one of the two examinations?

Detailed Solution for MCQ Test: Tabular Graph - 1 - Question 15

Pass percentages in at least one of the two examinations for different sections are:

Clearly, the pass percentage is maximum for Section D.

MCQ Test: Tabular Graph - 1 - Question 16

Directions: Study the table given below and answer the questions that follow:
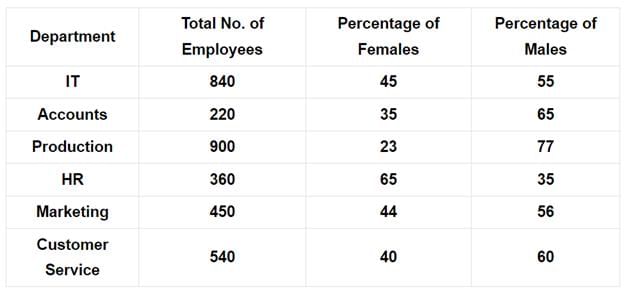
Total Number of Employees in different Departments of an Organization and Percentage of Females and Males.
Q. What is the total number of employees in all the departments together?

Detailed Solution for MCQ Test: Tabular Graph - 1 - Question 16

Total number of employees in all the departments
= 840 + 220 + 900 + 360 + 450 + 540
= 3310

MCQ Test: Tabular Graph - 1 - Question 17

Directions: Study the table given below and answer the questions that follow:
Total Number of Employees in different Departments of an Organization and Percentage of Females and Males.
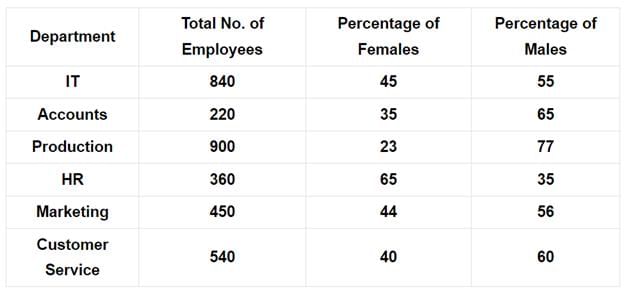
Q. The total number of employees in the HR department forms approximately what per cent of the total number of employees in the Accounts department?

Detailed Solution for MCQ Test: Tabular Graph - 1 - Question 17

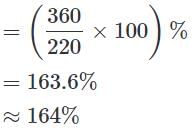
Required percentage

MCQ Test: Tabular Graph - 1 - Question 18

Directions: Study the table given below and answer the questions that follow:
Total Number of Employees in different Departments of an Organization and Percentage of Females and Males.
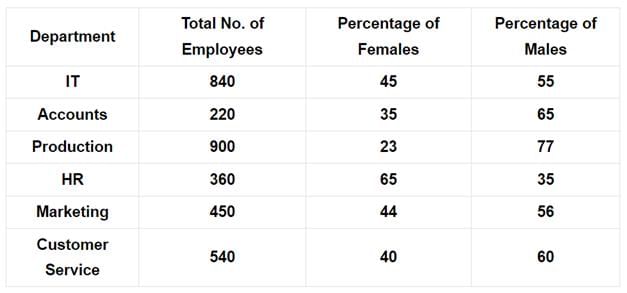
Q. What is the respective ratio of the number of females in Production department to the number of females in the Marketing department?

Detailed Solution for MCQ Test: Tabular Graph - 1 - Question 18

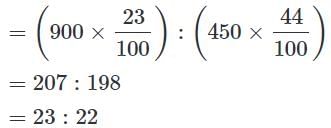
Number of females in Production : Number of females in Marketing

MCQ Test: Tabular Graph - 1 - Question 19

Directions: Study the table given below and answer the questions that follow:
Total Number of Employees in different Departments of an Organization and Percentage of Females and Males.
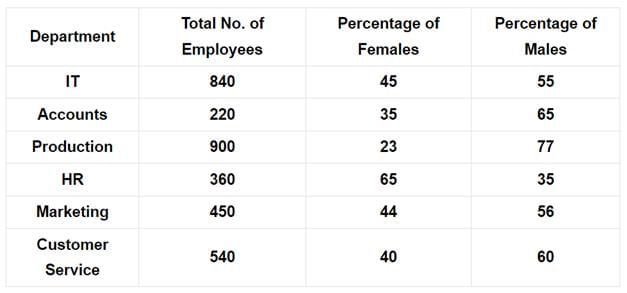
Q. What is the ratio of the number of females in the HR and Accounts department together to the number of males in the same department together?

Detailed Solution for MCQ Test: Tabular Graph - 1 - Question 19

(Number of females in HR and Accounts) : (Number of males in HR and Accounts)

= (234 + 77) : (126 + 143)
= 311 : 269

MCQ Test: Tabular Graph - 1 - Question 20

Directions: Study the table given below and answer the questions that follow:
Total Number of Employees in different Departments of an Organization and Percentage of Females and Males.
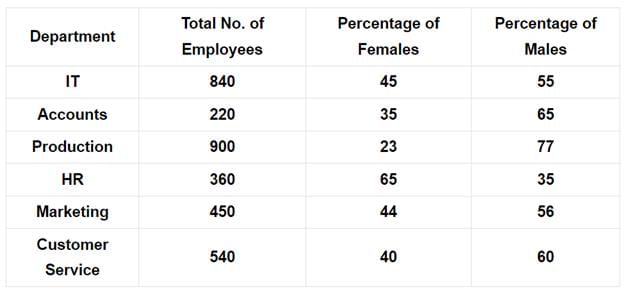
Q. What is the total number of males in the IT and Customer Service departments together?

Detailed Solution for MCQ Test: Tabular Graph - 1 - Question 20

Total number of males in IT and Customer Service

= 462 + 324
= 786

17 videos|9 docs|42 tests
Information about MCQ Test: Tabular Graph - 1 Page
In this test you can find the Exam questions for MCQ Test: Tabular Graph - 1 solved & explained in the simplest way possible. Besides giving Questions and answers for MCQ Test: Tabular Graph - 1, EduRev gives you an ample number of Online tests for practice
Download as PDF