Olympiad Test: Data Handling - Grade 8 MCQ
20 Questions MCQ Test - Olympiad Test: Data Handling

Read the table given above and answer the following questions.
Frequency distribution of daily income of 550 workers of a factory is given bellow
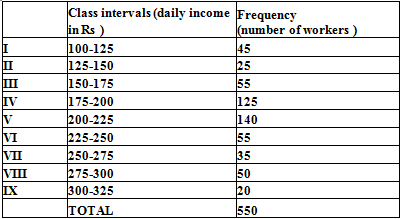
Q. What is the frequency of class intervals 125-150 ?
Frequency distribution of daily income of 550 workers of a factory is given bellow
Q. Which class has the highest frequency ?

Frequency distribution of daily income of 550 workers of a factory is given bellow
Q. Which class has the lowest frequency ?
Frequency distribution of daily income of 550 workers of a factory is given bellow
Q. What is the upper limit of the class interval 250-275?
Frequency distribution of daily income of 550 workers of a factory is given bellow
Q. Which two classes have the same frequency?
The number of hours for which students of particular class watched television during holidays is shown through the graph given below:

Q. For how many hours did the maximum number of students watch TV?
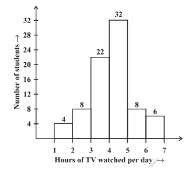
The number of hours for which students of particular class watched television during holidays is shown through the graph given below:
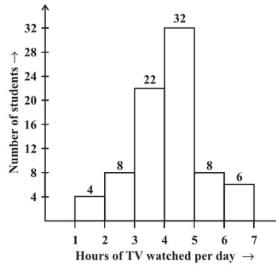
Q. How many students watched TV for less than 4 hrs ?
The number of hours for which students of particular class watched television during holidays is shown through the graph given below:

Q. How many students spent more than 5 hrs in TV watching ?
The number of hours for which students of particular class watched television during holidays is shown through the graph given below:

Q. For how many hours did the minimum number of students watch TV ?
The number of hours for which students of particular class watched television during holidays is shown through the graph given below:
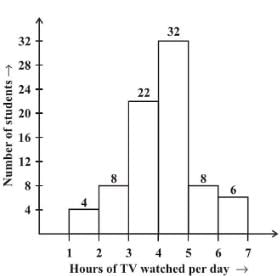
Q. How many students spent more than 5 hrs in TV watching ?
Which of the following is the probability of an impossible event?
Adjoining pie-chart gives the expenditure (in %age) on various items and savings of a family during a month .
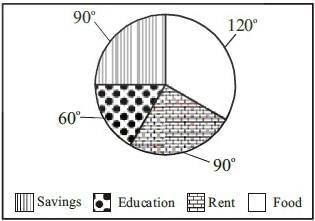
Q. On which item the expenditure was minimum ?
A coin is tossed. Which of the following is the probability of getting a head or tail?
Adjoining pie-chart gives the expenditure (in %age) on various items and savings of a family during a month .
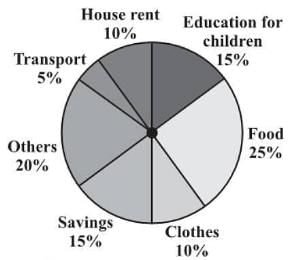
Q. If the monthly savings of the family is Rs 3000, What is the monthly expenditure on cloths ?
The range of the data: 6,14,20,16,6,5,4,18,25,15, and 5 is
Numbers 1 to 10 are written on ten separates slips (one number on one slip), kept in a box and mixed well. One slip is chosen from the box without looking in to it .
Q. What is the probability of getting a number 6?
Numbers 1 to 10 are written on ten separates slips (one number on one slip), kept in a box and mixed well. One slip is chosen from the box without looking in to it.
Q. What is the probability of getting a number less than 6?
Numbers 1 to 10 are written on ten separates slips (one number on one slip), kept in a box and mixed well. One slip is chosen from the box without looking in to it.
Q. What is the probability of getting a number greater than 6?
Numbers 1 to 10 are written on ten separates slips (one number on one slip), kept in a box and mixed well. One slip is chosen from the box without looking in to it.
Q. What is the probability of getting a 1-digit number ?
Numbers 1 to 10 are written on ten separates slips (one number on one slip), kept in a box and mixed well. One slip is chosen from the box without looking in to it.
Q. What is the probability of getting an even number ?
Important Questions for Olympiad Test: Data Handling
Olympiad Test: Data Handling MCQs with Answers
Online Tests for Olympiad Test: Data Handling
|
© EduRev
|
Education Revolution
|


|


