Olympiad Test Level 1: Data Handling - Class 3 MCQ
20 Questions MCQ Test Mathematics Olympiad for Class 3 - Olympiad Test Level 1: Data Handling
The given Directions: A pictograph shows the number of books of different subjects in a library. Study the pictograph carefully and answer the following questions.
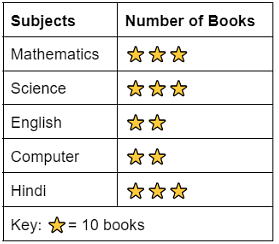
Q. What is the difference between the number of books of Mathematics and the number of books of English and Hindi together?

Direction: Saniya represented some data in the form of a bar graph about the favourite game of her classmates. The bar graph is shown below:
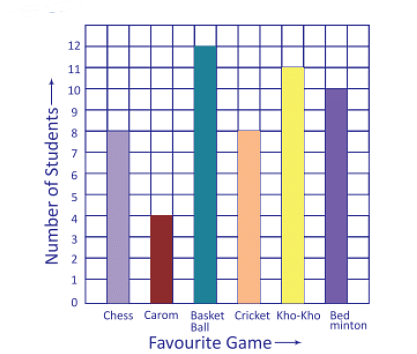
After a careful reading and understanding of the above bar graph, answer the following question:
Q. Which game is liked by exactly 11 students?

| 1 Crore+ students have signed up on EduRev. Have you? Download the App |
Direction: Saniya represented some data in the form of a bar graph about the favourite game of her classmates. The bar graph is shown below:
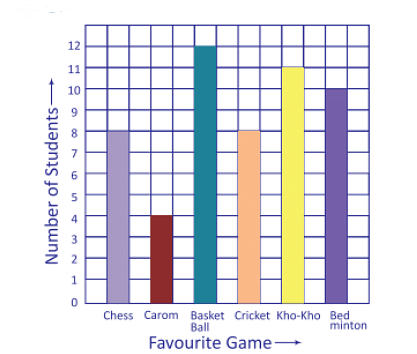
After a careful reading and understanding of the above bar graph, answer the following question:
Q. Which is your most favourite game among the students?

Directions: Read and understand the following pictograph and answer the questions that follow. The data given here represents the number of different types of biscuit packs bought for a party.
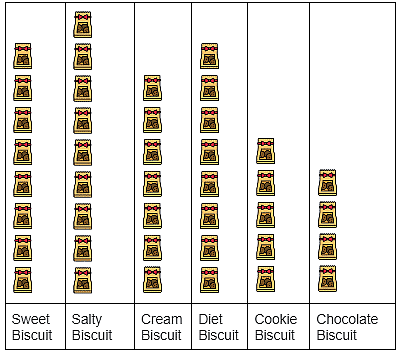
Key: ![]() = 10 Biscuit Packs
= 10 Biscuit Packs
Q. How many packs of Cream biscuits were bought?
Directions : Read and understand the following pictograph and answer the questions that follow. The data given here represents the number of different types of biscuit packs bought for a party.
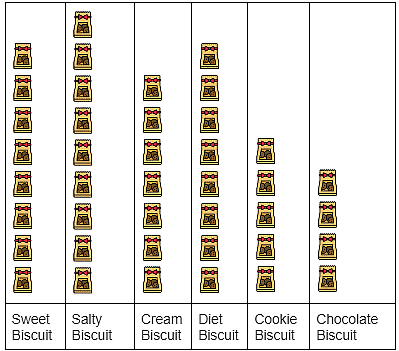
Key:  = 10 Biscuit Packs
Q. Which types of biscuits are bought equal in quantity?
Read and understand the following pictograph and answer the questions that follow. The data given here represents the number of pencils each kid has with them.
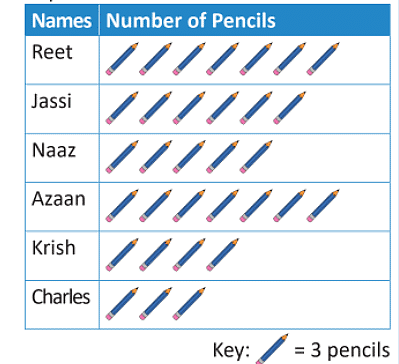
Q. How many pencils does Jassi have with her?
Read and understand the following pictograph and answer the questions that follow. The data given here represents the number of pencils each kid has with them.
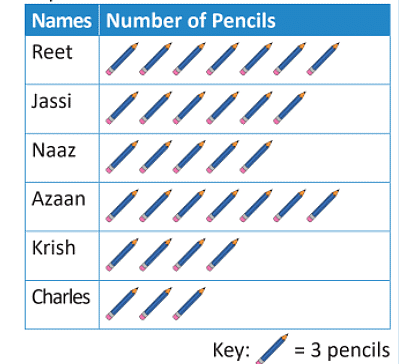
Q. Which student has 15 pencils with him/her?
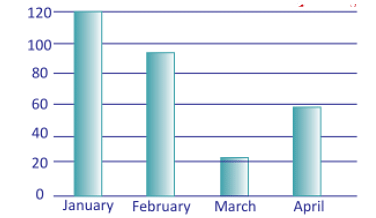
Production of cars at the car manufacturing unit is given below. In which month, the production of the company was maximum?
The following figure is the map of a village. If scale is 1 tree = 145 trees, how many trees are there in the village?

The given bar graph shows the types of sports people like.
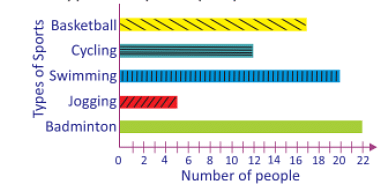
Q. 7 less people prefer jogging from_______.
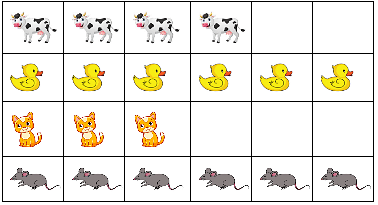
Study the following pictograph and find which animal is the least in number?
The picture graph below shows the number of pencils that 5 boys have.
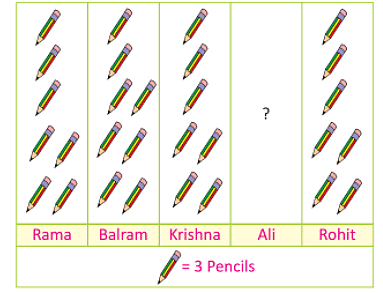
If there are a total 120 pencils, then Ali has _______ pencils.
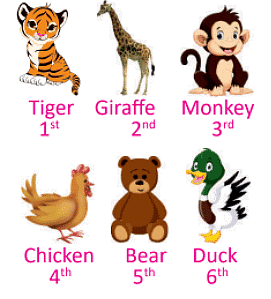
Monkey is the __________ animal from the left.
The given Directions: A pictograph shows the number of books of different subjects in a library. Study the pictograph carefully and answer the following questions.
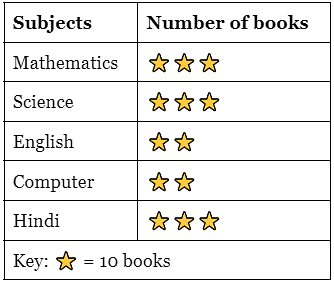
Q. There are _______ more Science books than Computer books in the library.
The given table shows the number of students who were absent on a day of a particular week.
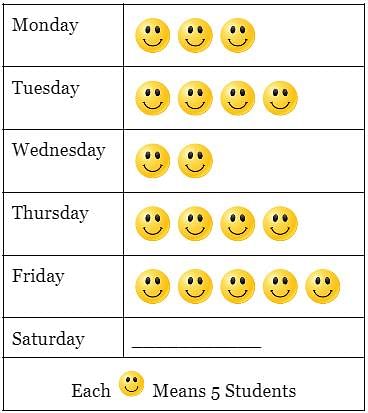
Q. How many children were absent on Thursday and Friday altogether?
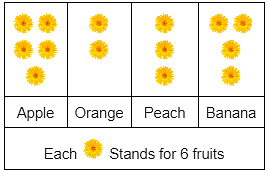
The given picture graph shows the favourite fruit of a group of pupils. Find the total number of fruits.
The information which is printed on the board outside the cinema hall is ![]() = 20 chairs, sitting arrangement inside the cinema hall is as follows:
= 20 chairs, sitting arrangement inside the cinema hall is as follows:
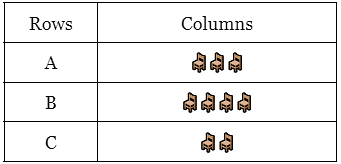
How many chairs are there in the cinema hall?
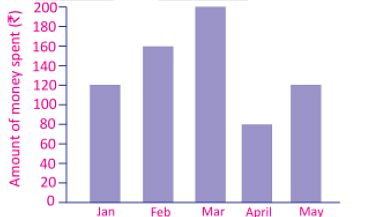
The bar graph shows the amount of money Latika spends in 5 months. She spent the same amount in _______ and ________.
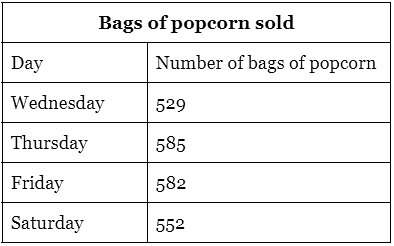
The given graph shows how many bags of popcorn Riya sold in the past four days. On which day did Riya sell the most bags of popcorn?
Read and understand the following pictograph and answer the questions that follow. The data given here represents the number of pencils each kid has with them.
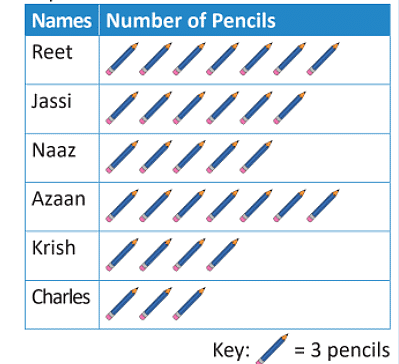
Q. Which student has the least number of pencils with him/her?
|
42 videos|35 docs|56 tests
|
|
42 videos|35 docs|56 tests
|


 = 3 × 10 = 30
 = 2 × 10 = 20
 = 3 × 10 = 30
 = 3 × 10 = 30
 = 2 × 10 = 20


