Olympiad Test: Motion- 1 - Class 9 MCQ
10 Questions MCQ Test Science Olympiad Class 9 - Olympiad Test: Motion- 1

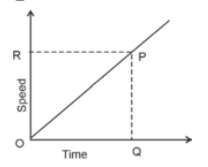
The quantity which is measured by the area occupied under the speed-time graph is
A bus increases its speed from 36 km/h to 72 km/h in 10 seconds. Its acceleration is
| 1 Crore+ students have signed up on EduRev. Have you? Download the App |
An object moving with a velocity of 30 m/s decelerates at the rate of 1.5 m/s2. Find the time taken by the object to come to rest
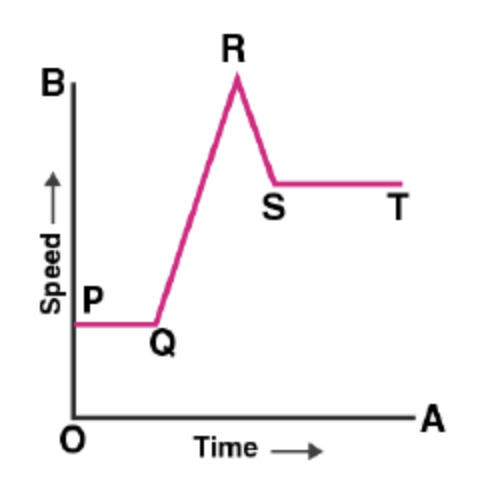
In the speed-time graph for a moving object shown here, the part which indicates uniform deceleration of the object is
A train starting from rest attains a velocity of 72 km/h in 5 minutes. Assuming that the acceleration is uniform, find the distance travelled by the train for attaining this velocity
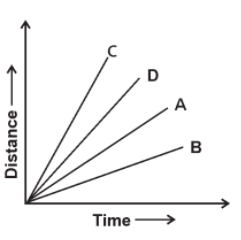
Four cyclists A, B, C, and D are cycling on a levelled straight road. Their distance–time graphs are shown in the given figure. Which of the following is correct regarding the motion of these cyclists?
A car of mass 1000 kg is moving with a velocity of 10 ms–1. If the velocity–time graph for this car is a horizontal line parallel to the time–axis, then the velocity of car at the end of 25 s will be
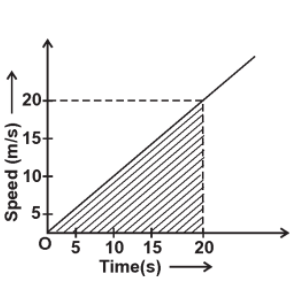
What is the distance covered by a particle during the time interval of 20 seconds, for which the speed–time graph is shown in the adjacent figure
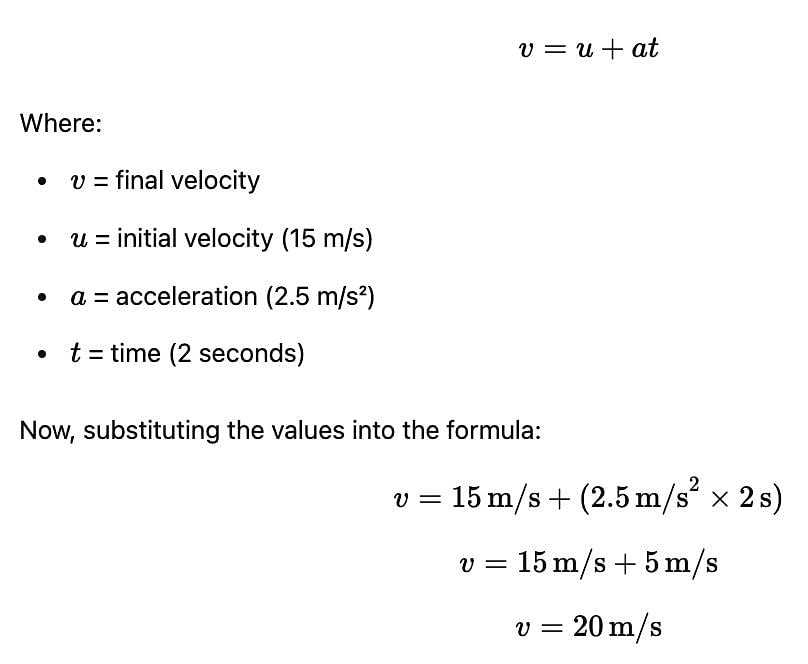
A bus moving along a straight line at 15 m/s undergoes an acceleration 2.5 m/s2 . After 2 seconds,its speed will be,
|
20 videos|55 docs|52 tests
|
|
20 videos|55 docs|52 tests
|
Top Courses for Class 9


Important Questions for Olympiad Test: Motion- 1
Olympiad Test: Motion- 1 MCQs with Answers
Online Tests for Olympiad Test: Motion- 1 Science Olympiad Class 9
|
© EduRev
|
Education Revolution
|


|


