Olympiad Test: Pictorial Representation Of Data - 2 - Class 4 MCQ
10 Questions MCQ Test Online MCQ Tests for Class 4 - Olympiad Test: Pictorial Representation Of Data - 2
Directions: The table given below shows the number of people watching at various football grounds. Round each number to the nearest thousand and put the answers in right column. Then answers the questions that follow :
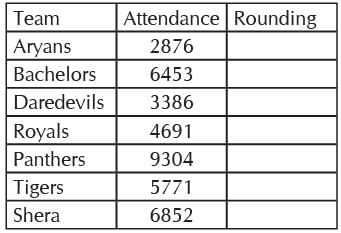
If Tigers : 6000 : : Bachelors : ?

If Tigers : 6000 : : Bachelors : ?
Directions: The table given below shows the number of people watching at various football grounds. Round each number to the nearest thousand and put the answers in right column. Then answers the questions that follow :

If Royals : 5000 : : ? : 7000

If Royals : 5000 : : ? : 7000
| 1 Crore+ students have signed up on EduRev. Have you? Download the App |
Direction: Golu kept a record of the birds she saw each day for five days. He presented his observation as a pictograph. Read the pictograph given and answer questions that follow:
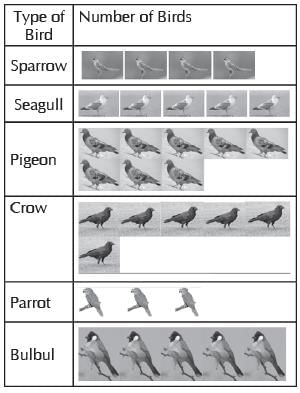
How many crow did he saw?

How many crow did he saw?
Direction: Golu kept a record of the birds she saw each day for five days. He presented his observation as a pictograph. Read the pictograph given and answer questions that follow:
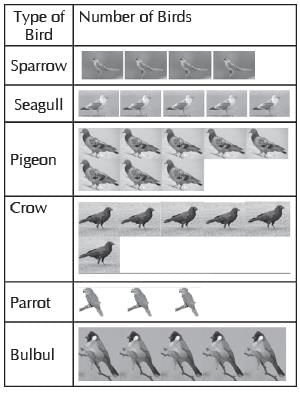
How many more pigeon than sparrow?
Direction: Golu kept a record of the birds she saw each day for five days. He presented his observation as a pictograph. Read the pictograph given and answer questions that follow:
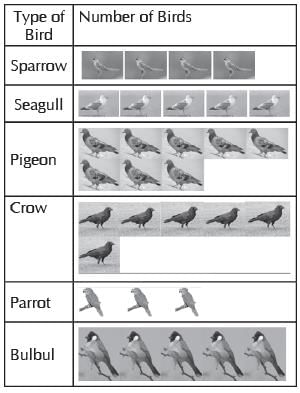
How many less parrots than seagull?
Direction: Golu kept a record of the birds she saw each day for five days. He presented his observation as a pictograph. Read the pictograph given and answer questions that follow:
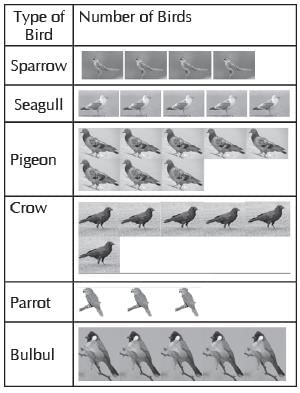
Which bird was seen as many times as bulbul?
Direction: Golu kept a record of the birds she saw each day for five days. He presented his observation as a pictograph. Read the pictograph given and answer questions that follow:
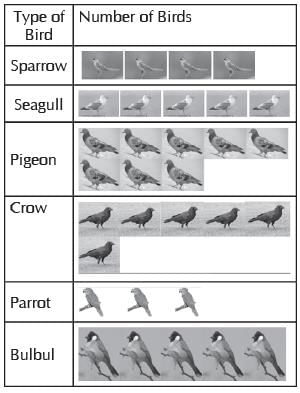
State True/false for following :
1. Pigeon was seen more than crow
2. Bulbul was seen less than seagull.
3. Sparrow was seen equal times as parrot
4. Pigeon was seen more than bulbul.
Direction: Golu kept a record of the birds she saw each day for five days. He presented his observation as a pictograph. Read the pictograph given and answer questions that follow:
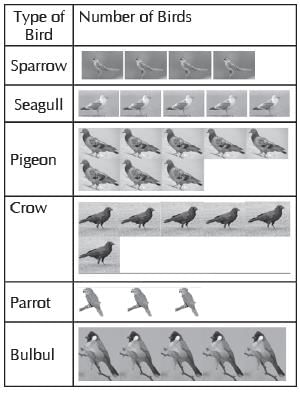
Which bird was seen maximum number of times?
Direction: Golu kept a record of the birds she saw each day for five days. He presented his observation as a pictograph. Read the pictograph given and answer questions that follow:
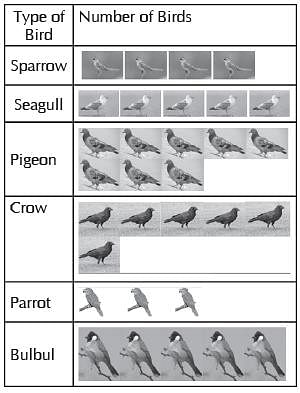
Which bird was seen minimum number of times?
Which of the following statements is/are correct?
1. When we give information (data) about a quantity through pictures, it is called a Bar graph
2. When we give information (data) about a quantity through horizontal or vertical bars, it is called bar graph.
|
1 docs|344 tests
|


