LR Exam  >  LR Tests  >  Pie Graph - Practice Test (With Solutions) CAT, Common Admission Test - LR MCQ

Pie Graph - Practice Test (With Solutions) CAT, Common Admission Test - LR MCQ


Test Description

12 Questions MCQ Test - Pie Graph - Practice Test (With Solutions) CAT, Common Admission Test

Pie Graph - Practice Test (With Solutions) CAT, Common Admission Test for LR 2025 is part of LR preparation. The Pie Graph - Practice Test (With Solutions) CAT, Common Admission Test questions and answers have been prepared according to the LR exam syllabus.The Pie Graph - Practice Test (With Solutions) CAT, Common Admission Test MCQs are made for LR 2025 Exam. Find important definitions, questions, notes, meanings, examples, exercises, MCQs and online tests for Pie Graph - Practice Test (With Solutions) CAT, Common Admission Test below.
Solutions of Pie Graph - Practice Test (With Solutions) CAT, Common Admission Test questions in English are available as part of our course for LR & Pie Graph - Practice Test (With Solutions) CAT, Common Admission Test solutions in Hindi for LR course. Download more important topics, notes, lectures and mock test series for LR Exam by signing up for free. Attempt Pie Graph - Practice Test (With Solutions) CAT, Common Admission Test | 12 questions in 24 minutes | Mock test for LR preparation | Free important questions MCQ to study for LR Exam | Download free PDF with solutions
Pie Graph - Practice Test (With Solutions) CAT, Common Admission Test - Question 1

Refer to the following pie chart and solve the questions based on it.
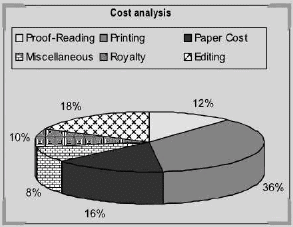
What is the central angle showing the cost of paper?

Detailed Solution for Pie Graph - Practice Test (With Solutions) CAT, Common Admission Test - Question 1

Required Angle = (16/100 x 360) = 57.6°

Pie Graph - Practice Test (With Solutions) CAT, Common Admission Test - Question 2

Refer to the following pie chart and solve the questions based on it.

The royalty on the book is less than the editing expenditure by

Detailed Solution for Pie Graph - Practice Test (With Solutions) CAT, Common Admission Test - Question 2

If the editing charges are Rs 18, royalty is Rs 10. On Rs 18, it is less by 8. On Rs 100, it is less by (8/18 x 100)% = 44.44%

Pie Graph - Practice Test (With Solutions) CAT, Common Admission Test - Question 3

Refer to the following pie charts and solve the questions based on it* The pie charts given below represent the market share of different players in the electronics market in the year 1995 and 2000 A new player F has entered the market in the given period
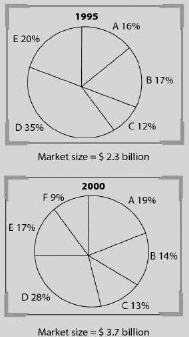
What is the percentage increase in the sales of A in the year 2000 over 1995?

Detailed Solution for Pie Graph - Practice Test (With Solutions) CAT, Common Admission Test - Question 3

There are two successive increases—First is the total increase of 60% approx.( $ 3.7 bn in 2000 from $ 2.3 billion in 1995) and second is the percentage share of A by 20% approx. Hence total percentage increase = 92%.

Pie Graph - Practice Test (With Solutions) CAT, Common Admission Test - Question 4

Refer to the following pie charts and solve the questions based on it* The pie charts given below represent the market share of different players in the electronics market in the year 1995 and 2000 A new player F has entered the market in the given period

If the new entrant F has grown at the expense of B, C, and E, what would be the change in the net value of sales of E in the year 2000, had F not entered the market?

Detailed Solution for Pie Graph - Practice Test (With Solutions) CAT, Common Admission Test - Question 4

Since we do not know what part of market share of B. C and E has been eaten up by F, so cannot be determined.

Pie Graph - Practice Test (With Solutions) CAT, Common Admission Test - Question 5

The following pie-chart shows the percentage distribution of the expenditure incurred in publishing a book. Study the pie-chart and the answer the questions based on it.

Various Expenditures (in percentage) Incurred in Publishing a BookIf for a certain quantity of books, the publisher has to pay Rs. 30,600 as printing cost, then what will be amount of royalty to be paid for these books?

Detailed Solution for Pie Graph - Practice Test (With Solutions) CAT, Common Admission Test - Question 5

Let the amount of Royalty to be paid for these books be Rs. r.

Pie Graph - Practice Test (With Solutions) CAT, Common Admission Test - Question 6

The following pie-chart shows the percentage distribution of the expenditure incurred in publishing a book. Study the pie-chart and the answer the questions based on it. What is the central angle of the sector corresponding to the expenditure incurred on Royalty?

Detailed Solution for Pie Graph - Practice Test (With Solutions) CAT, Common Admission Test - Question 6

Pie Graph - Practice Test (With Solutions) CAT, Common Admission Test - Question 7

Refer to the following pie charts and solve the questions based on It.
The two pie charts given below provide the expenses of two families:

Both the families decide to double the total expenditure keeping the pattern of spending the same as given above. What will be the new ratio of expenditure on food between family A and family B?

Detailed Solution for Pie Graph - Practice Test (With Solutions) CAT, Common Admission Test - Question 7

If the percentage increase in the expenditure of both the families is the same then the ratio will be the same

Pie Graph - Practice Test (With Solutions) CAT, Common Admission Test - Question 8

Refer to the following pie charts and solve the questions based on It.
The two pie charts given below provide the expenses of two families:

What will be the expenses on light by family A, as a percentage of expense on light by family B?

Detailed Solution for Pie Graph - Practice Test (With Solutions) CAT, Common Admission Test - Question 8
  • By visual inspection we can see that option (c) is the correct answer.
  • Expense by family A on light = (5/100) x 48000 = 2400
  • Expense by family B on light = (4/100) x 72000 = 2880
  • %age reqd = (2400/2880) x 100 = 83.33%
Pie Graph - Practice Test (With Solutions) CAT, Common Admission Test - Question 9

Refer to the following pie charts and solve the questions based on It.
The two pie charts given below provide the expenses of two families:

Under how many heads are the expenses of family B more than the expenses of family A?

Detailed Solution for Pie Graph - Practice Test (With Solutions) CAT, Common Admission Test - Question 9

By visual inspection we can see that the correct answer is option (b).

Pie Graph - Practice Test (With Solutions) CAT, Common Admission Test - Question 10

Refer to the following pie charts and solve the questions based on it.
The following pie charts represent the budget expenditure of certain countries on various sectors for the year in 2007:

A country is said to be progressive if its education, health and infrastructure expenditures are in the top four expenditure sectors. How many of the four countries are progressive?

Detailed Solution for Pie Graph - Practice Test (With Solutions) CAT, Common Admission Test - Question 10

By visual inspection we can see that option (a) is the correct answer.

Pie Graph - Practice Test (With Solutions) CAT, Common Admission Test - Question 11

Refer to the following pie charts and solve the questions based on it.
The following pie charts represent the budget expenditure of certain countries on various sectors for the year in 2007:

If a country is under military rule, it will spend maximum on defence and minimum on either health or education. How many of the above countries are under military rule?

Detailed Solution for Pie Graph - Practice Test (With Solutions) CAT, Common Admission Test - Question 11

Understand the logic that “If a country is under military rule, it will spend maximum on defence and minimum on either health or education” does not mean that if a country is spending maximum on defence and minimum on either health or education, then it will under military rule.

Pie Graph - Practice Test (With Solutions) CAT, Common Admission Test - Question 12

Refer to the following pie charts and solve the questions based on it.
The following pie charts represent the budget expenditure of certain countries on various sectors for the year in 2007:

If the budgetary expenditures of all the four countries are combined, which sector will account for the maximum expenditure?

Detailed Solution for Pie Graph - Practice Test (With Solutions) CAT, Common Admission Test - Question 12

Since individual expenditures of the countries are not given, we cannot determine it.

Information about Pie Graph - Practice Test (With Solutions) CAT, Common Admission Test Page
In this test you can find the Exam questions for Pie Graph - Practice Test (With Solutions) CAT, Common Admission Test solved & explained in the simplest way possible. Besides giving Questions and answers for Pie Graph - Practice Test (With Solutions) CAT, Common Admission Test, EduRev gives you an ample number of Online tests for practice
Download as PDF