SSC CGL Previous Year Questions: Data Interpretation - 3 - SSC CGL MCQ
30 Questions MCQ Test SSC CGL Mathematics Previous Year Paper (Topic-wise) - SSC CGL Previous Year Questions: Data Interpretation - 3
DIRECTIONS: Study the following table carefully to answer these questions: (SSC CGL 2017)

Q. Total number of students studying Arts from Insitutes A and B together is approximately what per cent of the total number of students studying computer Science from these two Institutes?

DIRECTIONS: Study the following table carefully to answer these questions: (SSC CGL 2017)

Q. What is the ratio between total number of students studying Science from Institutes C and D together and the total number of students studying Computers Science from these two Institutes together respectively?

| 1 Crore+ students have signed up on EduRev. Have you? Download the App |
DIRECTIONS: Study the following table carefully to answer these questions: (SSC CGL 2017)

Q. What is the average number of students studying all disciplines together from institute E?

DIRECTIONS: The bar graph shows the results of an annual examination in a secondary school in a certain year. (SSC Sub Ins. 2016)

Q. The ratio of the total number of boys passed to the total number of girls passed in the three classes VII, VIII and IX is
DIRECTIONS: The bar graph shows the results of an annual examination in a secondary school in a certain year. (SSC Sub Ins. 2016)
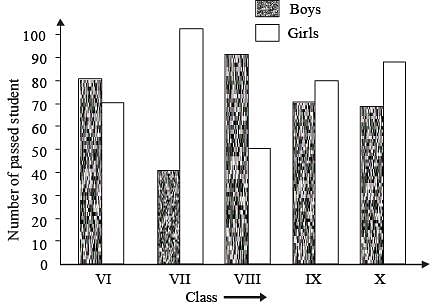
Q. The average number of boys passed per class is
DIRECTIONS: The bar graph shows the results of an annual examination in a secondary school in a certain year. (SSC Sub Ins. 2016)
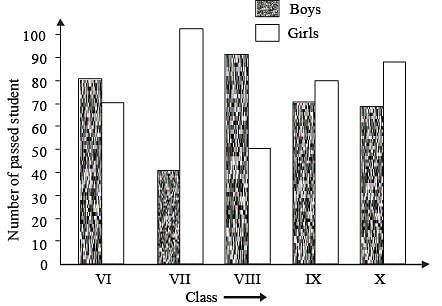
Q. The class having the highest number of passed student is
DIRECTIONS: The bar graph shows the results of an annual examination in a secondary school in a certain year. (SSC Sub Ins. 2016)
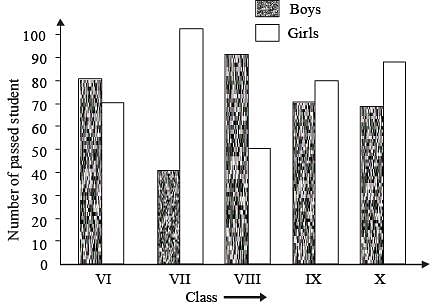
Q. The class in which the number of boys passed is nearest to the average number of girls passed per class, is
DIRECTIONS: Study the following table which shows the amount of money invested (Rupees in crore) in the core infrastructure areas of two districts. A and B of a State, and answer the below five questions. (SSC Sub Ins. 2016)
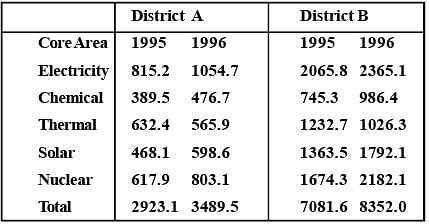
Q. By approximately what percent was the total investment in the two districts A and B more in 1996 as compared to 1995?
DIRECTIONS: Study the following table which shows the amount of money invested (Rupees in crore) in the core infrastructure areas of two districts. A and B of a State, and answer the below five questions. (SSC Sub Ins. 2016)
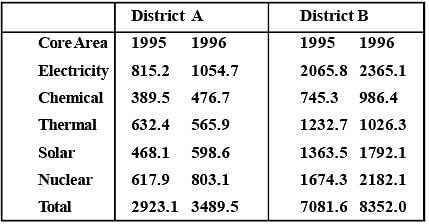
Q. The total investment in electricity and thermal energy in 1995, in these two districts A and B formed approximately what percent of the total investment made in that year?
DIRECTIONS: Study the following table which shows the amount of money invested (Rupees in crore) in the core infrastructure areas of two districts. A and B of a State, and answer the below five questions. (SSC Sub Ins. 2016)
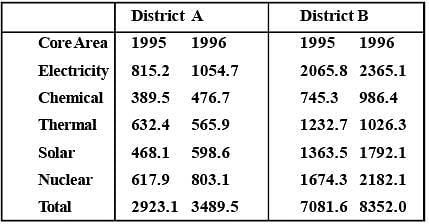
Q. In district B, the investment in which area in 1996 did show the highest percentage increase over the investment in that area in 1995?
DIRECTIONS: Study the following table which shows the amount of money invested (Rupees in crore) in the core infrastructure areas of two districts. A and B of a State, and answer the below five questions. (SSC Sub Ins. 2016)
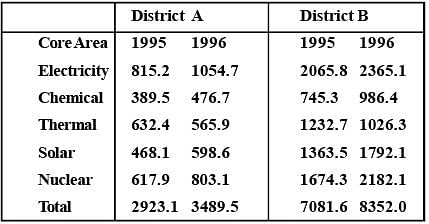
Q. Approximately how many times was the total investment in 1995 and 1996 in district B was that of total investment of district A in the same years?
DIRECTIONS: Study the following table which shows the amount of money invested (Rupees in crore) in the core infrastructure areas of two districts. A and B of a State, and answer the below five questions. (SSC Sub Ins. 2016)

Q. If the total investment in district B shows the same rate of increase in 1997, as it had shown from 1995 to 1996, what approximately would be the total investment in B in 1997?
DIRECTIONS: A bar graph showing the heights of six mountain peaks. Study the bar graph and answer questions. (SSC CGL 1st Sit. 2016)
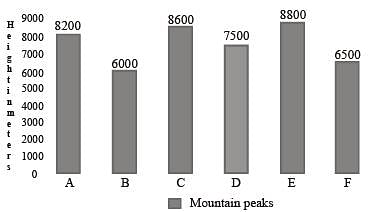
Q. The average height of all the peaks (in meters) is
DIRECTIONS: A bar graph showing the heights of six mountain peaks. Study the bar graph and answer questions. (SSC CGL 1st Sit. 2016)
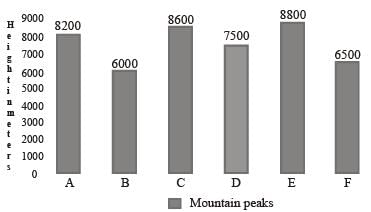
Q. Which peak is the second highest?
DIRECTIONS: A bar graph showing the heights of six mountain peaks. Study the bar graph and answer questions. (SSC CGL 1st Sit. 2016)
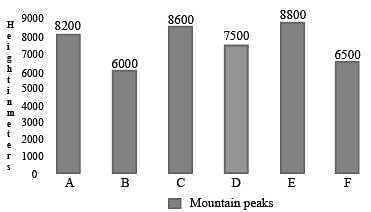
Q. Write the ratio of the heights of the highest peak and the lowest peak
DIRECTIONS: A bar graph showing the heights of six mountain peaks. Study the bar graph and answer questions. (SSC CGL 1st Sit. 2016)

Q. When the heights of the given peaks are written in ascending order, what is the average of the middle two peaks?
DIRECTIONS: The bar graph given indicates the income of a firm. Study the graph and answer the questions given. (SSC CGL 1st Sit. 2016)
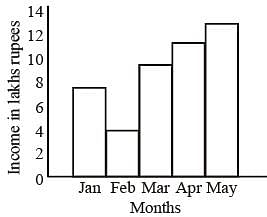
Q. Which period shows a steady increase of income?
DIRECTIONS: The bar graph given indicates the income of a firm. Study the graph and answer the questions given. (SSC CGL 1st Sit. 2016)
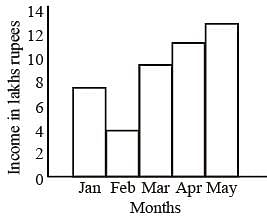
Q. During which month, the ratio of the income to that of the previous month is the largest?
DIRECTIONS: The bar graph given indicates the income of a firm. Study the graph and answer the questions given. (SSC CGL 1st Sit. 2016)
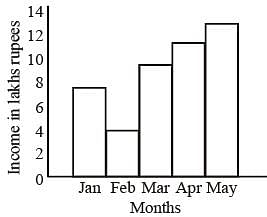
Q. The income of May is how many times to that of Februarey?
DIRECTIONS: The bar graph given indicates the income of a firm. Study the graph and answer the questions given. (SSC CGL 1st Sit. 2016)
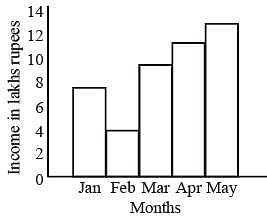
Q. The average monthly income of the firm (in lakh rupees) is
DIRECTIONS: The following piechart shows the study time of different subjects of a student in a day. Study the pie chart and answer the following questions. (SSC CGL 1st Sit. 2016)
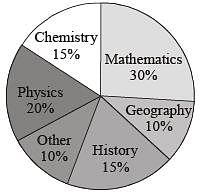
Q. The time spent to study history and chemistry is 4 hours 30 minutes. Then the student studied physics for
DIRECTIONS: The following piechart shows the study time of different subjects of a student in a day. Study the pie chart and answer the following questions. (SSC CGL 1st Sit. 2016)

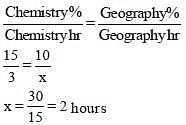
Q. If the student studied chemistry for 3 hours, then he/she studied geography for
DIRECTIONS: The following piechart shows the study time of different subjects of a student in a day. Study the pie chart and answer the following questions. (SSC CGL 1st Sit. 2016)
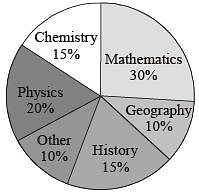
Q. If the student studied 10 hours in a day, then he/ she studied mathematics for.
DIRECTIONS: The following piechart shows the study time of different subjects of a student in a day. Study the pie chart and answer the following questions. (SSC CGL 1st Sit. 2016)
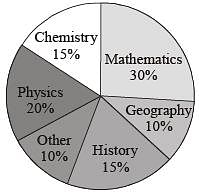
Q. Instead of 10% , if the student spends 15% to study other subjects and the time is taken from the time scheduled to study mathematics and if he/ she used to study 20 hours per day, then the difference of time for studying mathematics per day is
DIRECTIONS: The pie–chart given here shows expenditure incurred by a family on various items and their savings. Study the chart and answer the questions based on the pie–chart. (SSC CGL 1st Sit. 2015)
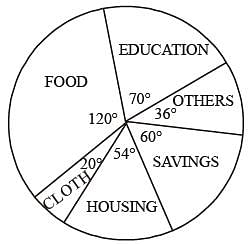
Q. If the monthly income is ₹ 36000 then the yearly savings is:
DIRECTIONS: The pie–chart given here shows expenditure incurred by a family on various items and their savings. Study the chart and answer the questions based on the pie–chart. (SSC CGL 1st Sit. 2015)
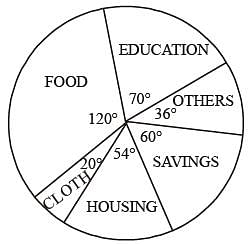
Q. If the expenditure on education is ₹1600 more than that of housing then the expenditure on food is:
DIRECTIONS: The pie–chart given here shows expenditure incurred by a family on various items and their savings. Study the chart and answer the questions based on the pie–chart. (SSC CGL 1st Sit. 2015)
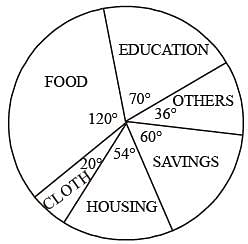
Q. The ratio of expenditure on food to savings is :
DIRECTIONS: Study the following bar diagram carefully and answer the following four Questions.
The number of the production of electronic items (TVs and LCDs) in a factory during the period from 2009 to 2013. (SSC CGL 1st Sit. 2015)
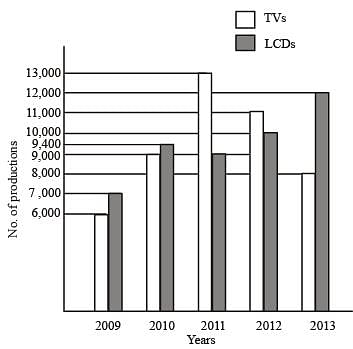
Q. The total number of production of electronic items is maximum in the year
DIRECTIONS: Study the following bar diagram carefully and answer the following four Questions.
The number of the production of electronic items (TVs and LCDs) in a factory during the period from 2009 to 2013. (SSC CGL 1st Sit. 2015)
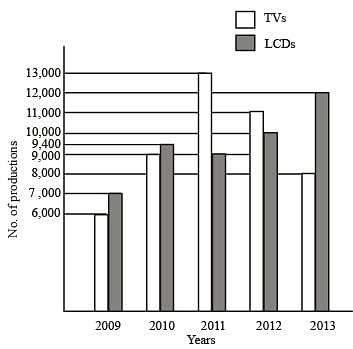
Q. The ratio of production of LCDs in the year 2011 and 2013 is
DIRECTIONS: Study the following bar diagram carefully and answer the following four Questions.
The number of the production of electronic items (TVs and LCDs) in a factory during the period from 2009 to 2013. (SSC CGL 1st Sit. 2015)

Q. The difference between averages of production of TVs and LCDs from 2009 to 2012 is
|
21 docs|55 tests
|
|
21 docs|55 tests
|


 = 78
= 78

