SSC CGL Exam  >  SSC CGL Tests  >  SSC CGL Reasoning Ability Previous Year Paper (Topic-wise)  >  SSC CGL Previous Year Questions: Venn Diagram - 2 - SSC CGL MCQ

SSC CGL Previous Year Questions: Venn Diagram - 2 - SSC CGL MCQ


Test Description

30 Questions MCQ Test SSC CGL Reasoning Ability Previous Year Paper (Topic-wise) - SSC CGL Previous Year Questions: Venn Diagram - 2

SSC CGL Previous Year Questions: Venn Diagram - 2 for SSC CGL 2025 is part of SSC CGL Reasoning Ability Previous Year Paper (Topic-wise) preparation. The SSC CGL Previous Year Questions: Venn Diagram - 2 questions and answers have been prepared according to the SSC CGL exam syllabus.The SSC CGL Previous Year Questions: Venn Diagram - 2 MCQs are made for SSC CGL 2025 Exam. Find important definitions, questions, notes, meanings, examples, exercises, MCQs and online tests for SSC CGL Previous Year Questions: Venn Diagram - 2 below.
Solutions of SSC CGL Previous Year Questions: Venn Diagram - 2 questions in English are available as part of our SSC CGL Reasoning Ability Previous Year Paper (Topic-wise) for SSC CGL & SSC CGL Previous Year Questions: Venn Diagram - 2 solutions in Hindi for SSC CGL Reasoning Ability Previous Year Paper (Topic-wise) course. Download more important topics, notes, lectures and mock test series for SSC CGL Exam by signing up for free. Attempt SSC CGL Previous Year Questions: Venn Diagram - 2 | 30 questions in 30 minutes | Mock test for SSC CGL preparation | Free important questions MCQ to study SSC CGL Reasoning Ability Previous Year Paper (Topic-wise) for SSC CGL Exam | Download free PDF with solutions
SSC CGL Previous Year Questions: Venn Diagram - 2 - Question 1

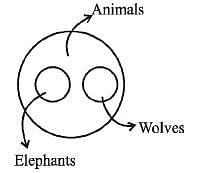
Which of the following diagrams correctly represents elephants, wolves, animals?        (SSC CGL 1st Sit. 2016)

Detailed Solution for SSC CGL Previous Year Questions: Venn Diagram - 2 - Question 1

SSC CGL Previous Year Questions: Venn Diagram - 2 - Question 2

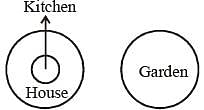
Which one of the following figures best represents the relationship among Kitchen, House and Garden?   (SSC CGL 1st Sit. 2016)

Detailed Solution for SSC CGL Previous Year Questions: Venn Diagram - 2 - Question 2


As kitchen is in house and Garden is outside the house.

SSC CGL Previous Year Questions: Venn Diagram - 2 - Question 3

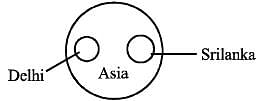
Identify the diagram that best represents the relationship among classes given below:  (SSC CGL 1st Sit. 2016)
Delhi, Sri Lanka, Asia

Detailed Solution for SSC CGL Previous Year Questions: Venn Diagram - 2 - Question 3


Delhi and Srilanka both are in Asia.

SSC CGL Previous Year Questions: Venn Diagram - 2 - Question 4

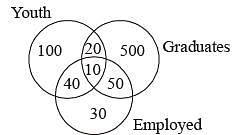
If the number indicates the number of persons, then how many youth graduates are there ?     (SSC Steno. 2016)
Detailed Solution for SSC CGL Previous Year Questions: Venn Diagram - 2 - Question 4

20 youth are graduates

SSC CGL Previous Year Questions: Venn Diagram - 2 - Question 5

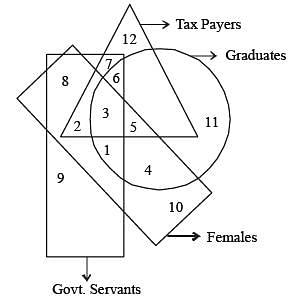
The in formation collected th rough a survey con ducted among the public is represented in the Venn diagram given below. Study the diagram and answer the question.Which of the following represents Govt. Servents who are tax payers, but are neither females nor graduates?  (SSC SI 2016)
Detailed Solution for SSC CGL Previous Year Questions: Venn Diagram - 2 - Question 5

'7' represents Govt. servants who are tax payers, but are neither females nor graduates.

SSC CGL Previous Year Questions: Venn Diagram - 2 - Question 6

Which of the following diagrams represents the cor rect relationship between Doctors, Specialist Doctors and Patients?   (SSC SI 2016)

Detailed Solution for SSC CGL Previous Year Questions: Venn Diagram - 2 - Question 6

Option (b) is correct.
patient can specialist doctor or doctor 
and specialist doctor is subset of doctor so option (b) is the best suited

SSC CGL Previous Year Questions: Venn Diagram - 2 - Question 7

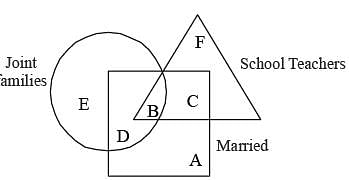
Triangle represents school teachers. Squar e r epresents married persons. Circles represents persons living in joint families. Married persons living in Joint families but not working as school teachers are represented by   (SSC SI 2016)
Detailed Solution for SSC CGL Previous Year Questions: Venn Diagram - 2 - Question 7

Married persons living in joint families but not working as school teachers are represented by 'D'.

SSC CGL Previous Year Questions: Venn Diagram - 2 - Question 8

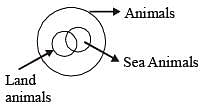
Identify the diagram that best represents the relationship among the classes given below :    (SSC CGL 1st Sit. 2015)

Animals and land animals, sea animals

Detailed Solution for SSC CGL Previous Year Questions: Venn Diagram - 2 - Question 8

SSC CGL Previous Year Questions: Venn Diagram - 2 - Question 9

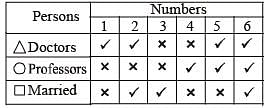
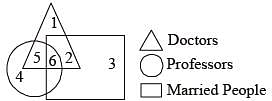
Which number indicates doctors who are not married ?    (SSC CGL 1st Sit. 2015)
Detailed Solution for SSC CGL Previous Year Questions: Venn Diagram - 2 - Question 9


Number 1 indicates doctors who are not married

SSC CGL Previous Year Questions: Venn Diagram - 2 - Question 10

In the fig.         (SSC CGL 1st Sit. 2015)

Q represents all quadrilaterals
K represents all Kites
R represents all Rhombus
P represents all Parallelogram
​​​​​​​The statement 'Rhombus is also a Kite' can be described as

Detailed Solution for SSC CGL Previous Year Questions: Venn Diagram - 2 - Question 10

P and K is nothing but R.

SSC CGL Previous Year Questions: Venn Diagram - 2 - Question 11

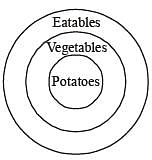
Identify the diagram that best represents the relationship among classes given below :  (SSC CGL 1st Sit. 2015)
Vegetables, Potatoes, Eatables

Detailed Solution for SSC CGL Previous Year Questions: Venn Diagram - 2 - Question 11

SSC CGL Previous Year Questions: Venn Diagram - 2 - Question 12

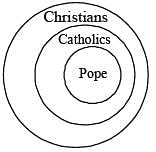
Identify the diagram that best represents the relationship among classes given below :  (SSC CGL 1st Sit. 2015)

Christians, Catholics, Pope

Detailed Solution for SSC CGL Previous Year Questions: Venn Diagram - 2 - Question 12

SSC CGL Previous Year Questions: Venn Diagram - 2 - Question 13

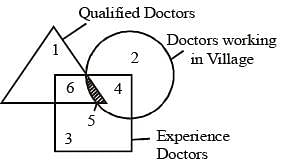
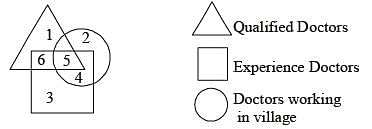
Study the diagram given below and answer question.
The Qualified and experienced doctors working in villages are represented by :       (SSC CGL 1st Sit. 2015)
Detailed Solution for SSC CGL Previous Year Questions: Venn Diagram - 2 - Question 13


Hence, shaded portion in above diagram represents.
Qualified Experienced Doctors working in village i.e. 5.

SSC CGL Previous Year Questions: Venn Diagram - 2 - Question 14

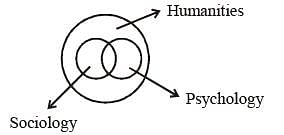
Wh ich of the following states the relation sh ip between Sociology, Psychology and Humanities ?  (SSC Sub. Ins. 2015)

Detailed Solution for SSC CGL Previous Year Questions: Venn Diagram - 2 - Question 14

SSC CGL Previous Year Questions: Venn Diagram - 2 - Question 15

Which venn diagram truly represents Teachers, Scholars and Students ?        (SSC Sub. Ins. 2015)

Detailed Solution for SSC CGL Previous Year Questions: Venn Diagram - 2 - Question 15

SSC CGL Previous Year Questions: Venn Diagram - 2 - Question 16

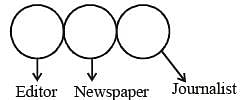
Which figure best represents the relationship between Editor, Newspaper and Journalist?     (SSC Sub. Ins. 2015)

Detailed Solution for SSC CGL Previous Year Questions: Venn Diagram - 2 - Question 16

Editor, Newspaper and Journalist are different classes with respect to each other,
though they may work for the same cause sometimes.
The correct Venn diagram is,


SSC CGL Previous Year Questions: Venn Diagram - 2 - Question 17

Which figure will best represent the relationship amongst the three classes ?            (SSC CHSL 2015)

Boy, Sportsman, Student

Detailed Solution for SSC CGL Previous Year Questions: Venn Diagram - 2 - Question 17

Some boys are sportsmen, some boys are studen ts some sportsmen are students.

SSC CGL Previous Year Questions: Venn Diagram - 2 - Question 18

Identify the diagram that best represents  the relationship among classes given below :      (SSC CHSL 2015)

Athletes, Sprinters, Marathon Runner

Detailed Solution for SSC CGL Previous Year Questions: Venn Diagram - 2 - Question 18

Sprinters and Marathon Runner both are ath letes.
Some Sprinters can be Marathon Runners also.

SSC CGL Previous Year Questions: Venn Diagram - 2 - Question 19

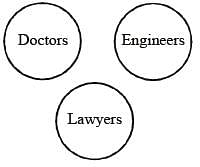
Identify the diagram that best represents the relationship among the classes given below : (SSC Multitasking 2014)

Doctors, Engineers, Lawyers

Detailed Solution for SSC CGL Previous Year Questions: Venn Diagram - 2 - Question 19

SSC CGL Previous Year Questions: Venn Diagram - 2 - Question 20

In a group of persons, 11 persons speak Kannada, 20 persons speak Tamil and 11 persons speak Telugu. In that group, if two persons speak two languages and one person speak all the languages, then how many persons are there in the group ?               (SSC CGL 2014)

Detailed Solution for SSC CGL Previous Year Questions: Venn Diagram - 2 - Question 20

19 + 1 + 1 + 1 + 10 + 10 =  42 persons

SSC CGL Previous Year Questions: Venn Diagram - 2 - Question 21

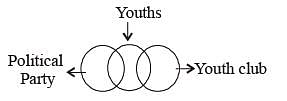
Which one of the following diagrams best depicts the relationship among Human Society - Youth Club, Political Party and Youths ?         (SSC CGL 2014)

Detailed Solution for SSC CGL Previous Year Questions: Venn Diagram - 2 - Question 21

SSC CGL Previous Year Questions: Venn Diagram - 2 - Question 22

Which one of the followin g diagrams represent correct relationship among pigeon, birds, dogs ? (SSC CGL 2014)

Detailed Solution for SSC CGL Previous Year Questions: Venn Diagram - 2 - Question 22

SSC CGL Previous Year Questions: Venn Diagram - 2 - Question 23

Identify the diagram that best represents the relationship among classes given below : (SSC Sub. Ins. 2014)

Food, Curd, Spoons

Detailed Solution for SSC CGL Previous Year Questions: Venn Diagram - 2 - Question 23

SSC CGL Previous Year Questions: Venn Diagram - 2 - Question 24

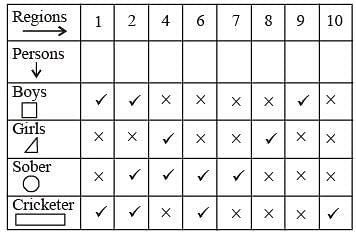
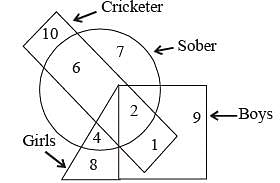
In the following figure, the boys who are cricketer and sober are indicated by which number ?    (SSC Sub. Ins. 2014)
Detailed Solution for SSC CGL Previous Year Questions: Venn Diagram - 2 - Question 24


Region 2 presents the boys who are cricketer and sober.

SSC CGL Previous Year Questions: Venn Diagram - 2 - Question 25

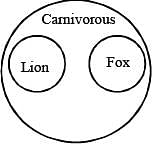
Which one of the following diagrams represents the correct relationship among:     (SSC CHSL 2014)

Lion, Fox and Carnivorous

Detailed Solution for SSC CGL Previous Year Questions: Venn Diagram - 2 - Question 25

SSC CGL Previous Year Questions: Venn Diagram - 2 - Question 26

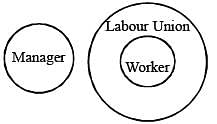
Which one of the following diagrams represents the correct relationship among:     (SSC CHSL 2014)

Manager, Labour Union and Worker

Detailed Solution for SSC CGL Previous Year Questions: Venn Diagram - 2 - Question 26

SSC CGL Previous Year Questions: Venn Diagram - 2 - Question 27

Select the venn diagram that correctly shows the relationship.            (SSC Steno. 2014)

Continent, City, Country

Detailed Solution for SSC CGL Previous Year Questions: Venn Diagram - 2 - Question 27

SSC CGL Previous Year Questions: Venn Diagram - 2 - Question 28

In a total population of 70, if 20 drink coffee and tea, 35 drink coffee, then select the correct venn diagram that shows
(1) how many drink only coffee?
(2) how many drink only tea?
A = Coffee drinkers
B = Tea drinkers          (SSC Steno. 2014) 

Detailed Solution for SSC CGL Previous Year Questions: Venn Diagram - 2 - Question 28

SSC CGL Previous Year Questions: Venn Diagram - 2 - Question 29

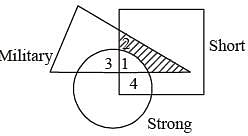
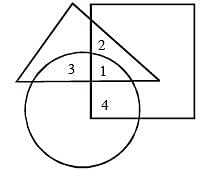
In the given diagram, Circle represents strong men, Square represents short men and Triangle represents military officers.
Which region represents military officers who are short but not strong?        (SSC Multitasking 2013)
Detailed Solution for SSC CGL Previous Year Questions: Venn Diagram - 2 - Question 29


Hence, darken portion in above diagram represents that there are 2 military officers who are short but not strong.

SSC CGL Previous Year Questions: Venn Diagram - 2 - Question 30

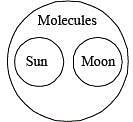
Which figure represents the relationship among Sun, Moon, Molecule ?     (SSC CGL 1st Sit. 2013)

Detailed Solution for SSC CGL Previous Year Questions: Venn Diagram - 2 - Question 30

Every thing is composed of molecules. Sun is different from Moon.

21 docs|45 tests
Information about SSC CGL Previous Year Questions: Venn Diagram - 2 Page
In this test you can find the Exam questions for SSC CGL Previous Year Questions: Venn Diagram - 2 solved & explained in the simplest way possible. Besides giving Questions and answers for SSC CGL Previous Year Questions: Venn Diagram - 2, EduRev gives you an ample number of Online tests for practice
Download as PDF