CUET Commerce Exam  >  CUET Commerce Tests  >  General Test Preparation for CUET  >  Test: Bar Graphs - CUET Commerce MCQ

Test: Bar Graphs - CUET Commerce MCQ


Test Description

15 Questions MCQ Test General Test Preparation for CUET - Test: Bar Graphs

Test: Bar Graphs for CUET Commerce 2024 is part of General Test Preparation for CUET preparation. The Test: Bar Graphs questions and answers have been prepared according to the CUET Commerce exam syllabus.The Test: Bar Graphs MCQs are made for CUET Commerce 2024 Exam. Find important definitions, questions, notes, meanings, examples, exercises, MCQs and online tests for Test: Bar Graphs below.
Solutions of Test: Bar Graphs questions in English are available as part of our General Test Preparation for CUET for CUET Commerce & Test: Bar Graphs solutions in Hindi for General Test Preparation for CUET course. Download more important topics, notes, lectures and mock test series for CUET Commerce Exam by signing up for free. Attempt Test: Bar Graphs | 15 questions in 20 minutes | Mock test for CUET Commerce preparation | Free important questions MCQ to study General Test Preparation for CUET for CUET Commerce Exam | Download free PDF with solutions
Test: Bar Graphs - Question 1

What was the increase in registration of vehicles other than Cars from January to April 1991?

Detailed Solution for Test: Bar Graphs - Question 1

No. of other vehicles registered in January 1991
= 27 - 21
= 6 thousand
No. of other vehicles registered in April 1991
= 35 - 20
= 15 thousand
Hence, increased
= 15 - 6
= 9 thousand

Test: Bar Graphs - Question 2

What is the difference between the number of cars registered in January and those registered in June?

Detailed Solution for Test: Bar Graphs - Question 2

Registered increase
= 28 - 21
= 7 thousand

1 Crore+ students have signed up on EduRev. Have you? Download the App
Test: Bar Graphs - Question 3

Which was the following month was the registration of vehicles other than Cars maximum?

Detailed Solution for Test: Bar Graphs - Question 3

No. of vehicles registered in May
= 35 - 17
= 18 is maximum in all.

Test: Bar Graphs - Question 4

What was the number of vehicles other than Cars registered in March, 1991?

Detailed Solution for Test: Bar Graphs - Question 4

No. of vehicles registered in March 1991
= 25 - 15
= 10 thousand

Test: Bar Graphs - Question 5

What was the percentage increase in registration of Cars from February to March 1991?

Detailed Solution for Test: Bar Graphs - Question 5

Registered % increase

Test: Bar Graphs - Question 6

Per year increase in population from the year 1951 to 2001 is

Detailed Solution for Test: Bar Graphs - Question 6

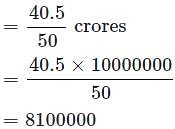
Total increase
  = 68.40 - 27.90
  = 40.5 crores
  Hence, annual increase

Test: Bar Graphs - Question 7

In which census year, the per cent increase in population is least as compared to that in the previous census year?

Detailed Solution for Test: Bar Graphs - Question 7

% increase in 1971
= [(36.14 × 31.85) × 100]
= 13.47% least in all

Test: Bar Graphs - Question 8

In which census year, the per cent increase in population is highest as compared to that in the previous census year?

Detailed Solution for Test: Bar Graphs - Question 8

Percentage increase in 2001 = 24.8

Test: Bar Graphs - Question 9

The percent increase in population from 1991 to 2001 is:

Detailed Solution for Test: Bar Graphs - Question 9

Increase in Population
= 68.40 - 54.80
= 13.6 crores

Test: Bar Graphs - Question 10

How many Naya mixer-grinder disposed off by end of 2000 ?

Detailed Solution for Test: Bar Graphs - Question 10

In the year 1998, (75 - 25) = 50 mixer-grinder purchased.
Then, In 2000, 20% of 50 disposed off = 10.
Similarly, number of mixer grinder purchased in 1997 is 25.
Number of mixer-grinder disposed in 1999 = 20% of 25 = 5.
Total number of mixer-grinder disposed off at end of 2000
= 10 + 5
= 15

Test: Bar Graphs - Question 11

Which region showed the highest growth in number of households in all the income categories for the period ?

Detailed Solution for Test: Bar Graphs - Question 11

From graph it is clear that southern region showed the highest growth in number of households in all the income categories for the period.

Test: Bar Graphs - Question 12

What was the total household income in northern region for upper-middle class?

Detailed Solution for Test: Bar Graphs - Question 12

Region wise breakup is not available. hence, question cannot be answered.

Test: Bar Graphs - Question 13

What is the percentage increase in total number of households for the northern region (upper-middle) over the given period ?

Detailed Solution for Test: Bar Graphs - Question 13

The percentage increase in total number of households for the northern region for upper-middle income category is 200%.

Test: Bar Graphs - Question 14

What was the average income of the high-income group in 1987-88?

Detailed Solution for Test: Bar Graphs - Question 14

It is clear from the table average income is Rs. 75,000.

Test: Bar Graphs - Question 15

If the price of B is Rs. 125 per unit, what is the sales revenue in the same year due to sale of B (in Rupees Lakhs)?

Detailed Solution for Test: Bar Graphs - Question 15

Assume the total production of the first year as 10000, second year becomes 12000, third year 14400 and fourth year 17280.
Then,
0.2 × 17280 - 0.2 × 12000 = 1056
But this difference is given as 2640. Hence, the value of production will be; 25000, 30000, 36000, and 43200 respectively for the 4 years.
∴ Revenue
= 125 × 0.4 × 30000
= 1500000

155 videos|399 docs|771 tests
Information about Test: Bar Graphs Page
In this test you can find the Exam questions for Test: Bar Graphs solved & explained in the simplest way possible. Besides giving Questions and answers for Test: Bar Graphs, EduRev gives you an ample number of Online tests for practice

Top Courses for CUET Commerce

155 videos|399 docs|771 tests
Download as PDF

Top Courses for CUET Commerce