Electrical Engineering (EE) Exam  >  Electrical Engineering (EE) Tests  >  GATE Electrical Engineering (EE) Mock Test Series 2025  >  Test: Bode Plot - 2 - Electrical Engineering (EE) MCQ

Test: Bode Plot - 2 - Electrical Engineering (EE) MCQ


Test Description

10 Questions MCQ Test GATE Electrical Engineering (EE) Mock Test Series 2025 - Test: Bode Plot - 2

Test: Bode Plot - 2 for Electrical Engineering (EE) 2025 is part of GATE Electrical Engineering (EE) Mock Test Series 2025 preparation. The Test: Bode Plot - 2 questions and answers have been prepared according to the Electrical Engineering (EE) exam syllabus.The Test: Bode Plot - 2 MCQs are made for Electrical Engineering (EE) 2025 Exam. Find important definitions, questions, notes, meanings, examples, exercises, MCQs and online tests for Test: Bode Plot - 2 below.
Solutions of Test: Bode Plot - 2 questions in English are available as part of our GATE Electrical Engineering (EE) Mock Test Series 2025 for Electrical Engineering (EE) & Test: Bode Plot - 2 solutions in Hindi for GATE Electrical Engineering (EE) Mock Test Series 2025 course. Download more important topics, notes, lectures and mock test series for Electrical Engineering (EE) Exam by signing up for free. Attempt Test: Bode Plot - 2 | 10 questions in 45 minutes | Mock test for Electrical Engineering (EE) preparation | Free important questions MCQ to study GATE Electrical Engineering (EE) Mock Test Series 2025 for Electrical Engineering (EE) Exam | Download free PDF with solutions
Test: Bode Plot - 2 - Question 1

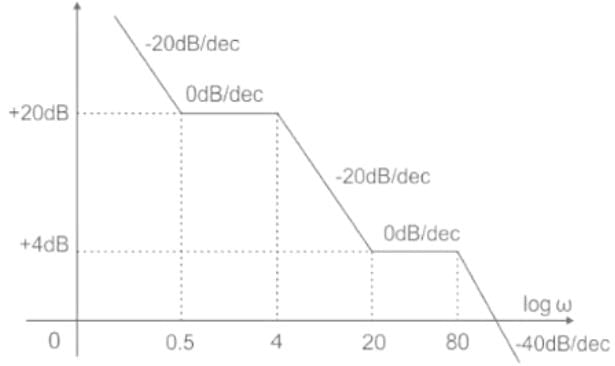
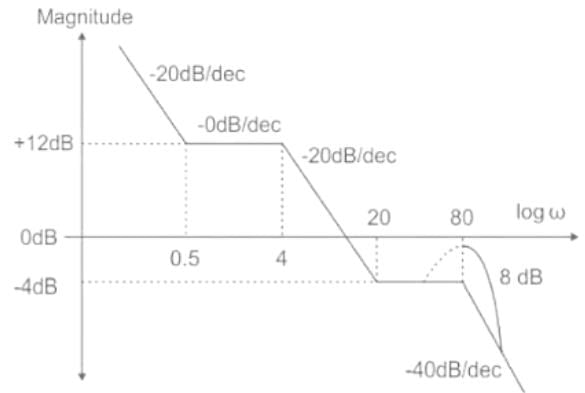
Find the transfer function, from the given plot with a correction of 8dB at ω= 80 rad/sec.
Detailed Solution for Test: Bode Plot - 2 - Question 1

It is given that we have to make a correction of 8dB in the magnitude at ω = 80 rad/sec.
So Bode plot is uplifted by 8dB, below is the graph after the correction.

The initial slop is -20dB/Dec which means we have one pole at the origin.
At ω= 0.5 slop changies from -20 to 0 dB/dec which means at ω = 0.5 we get one zero.
At ω = 4 slop changies from 0 to -20 dB/dec which means at ω = 4 we get one pole.
At ω= 20 slop changies from -20 to 0 dB/dec which means at ω = 20 we get one zero.
At ω = 80 slop changies from 0 to -40 dB/dec which means at ω = 80 we get two pole.
The Transfer function is given as 

 
The value of k can be calculated from the bode plot at ω = 1
∴ At ω = 1 given magnitude is 20dB
∴ 20log(k) = 20
∴ log(k) = 1
∴ k = 10
The transfer function after the correction is given as

Test: Bode Plot - 2 - Question 2

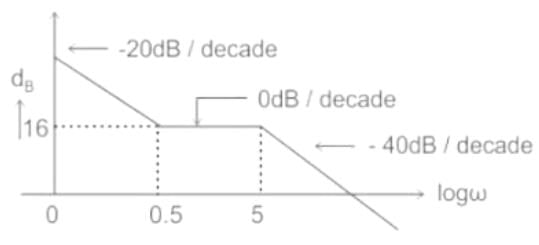
The asymptotic bode plot of a system is shown in figure. Find the expression for its transfer function in frequency domain -
Detailed Solution for Test: Bode Plot - 2 - Question 2

From observation of the Bode plot we have

  • Initial slope -20dB/decade ,which indicates type1 system with 1 pole at origin
  • Open-loop poles are at ωp = 5 (of order 2)
  • Open-loop zeros are at ωz = 0.5(of order 1)

Hence the overall open transfer function is given by

Analysis for calculation of K

  • K is open-loop gain
  • here n= 2 ,order of open-loop pole

Putting in values with S=jω in transfer function ,we have

let us calculate value of k
Note- ⇒ -20dB/decade = -6dB/octave
From initial slope
at ω = 0.5 ,magnitude is M = 16dB
So at ω = 1 magnitude will be M = (16dB-6dB) = 10 db
(As the initial slope is also -6db/octave if the frequency is doubled the magnitude is reduced by -6dB)
Magnitude at ω = 1 is also given by 20logK (in dB)
Hence ⇒ 20logK = 16
⇒ K = 3.154
⇒ K ≈ 3
Therefore the equivalent transfer function in the frequency domain is given by 

Hence option 1 is correct

Test: Bode Plot - 2 - Question 3

Bode plot consists of two separate plots, one of which consists of -

Detailed Solution for Test: Bode Plot - 2 - Question 3

Bode Plot:

  • A Bode plot is a graph commonly used in the control system to determine the stability of a control system. 
  • It can be drawn both for the open-loop and closed-loop systems.
  • A Bode plot maps the frequency response of the system through two graphs: the Bode magnitude plot and the Bode phase plot.

(​1) Bode magnitude plot:

  • It is plotted between the magnitude of the transfer function expressed in decibels (20 log10 |G(jω)|) versus the frequency expressed in log ω.

(​2) Bode phase plot:

  • It is plotted between the angle of the transfer function versus the frequency (ω).
Test: Bode Plot - 2 - Question 4

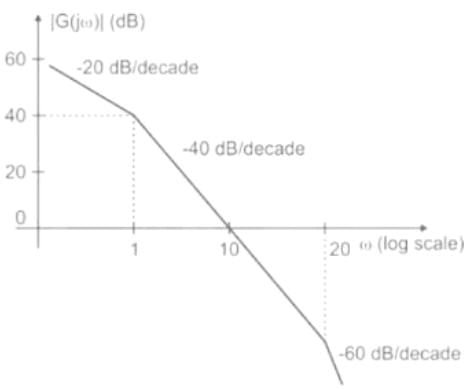
The asymptotic Bode magnitude plot of a minimum phase transfer function G(s) is shown below.
Consider the following two statements.
Statement I: Transfer function G(s) has three poles and one zero.
Statement II: At very high frequency (ω→∞), the phase angle ∠G (jω) = −3π/2.

Which one of the following options is correct?

Detailed Solution for Test: Bode Plot - 2 - Question 4

Form the given bode plot, we can write the transfer function as follows 

It has 3 poles and no zeros,
So, statement I is false
At ω → ∞, the phase angle

So, statement II is true

Test: Bode Plot - 2 - Question 5

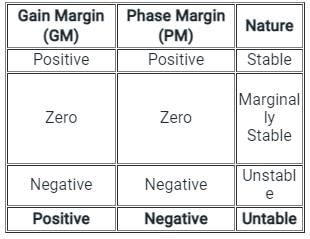
When the gain margin is positive and phase margin is negative, the system is:

Detailed Solution for Test: Bode Plot - 2 - Question 5

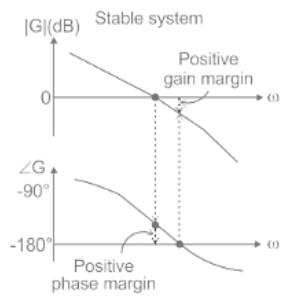
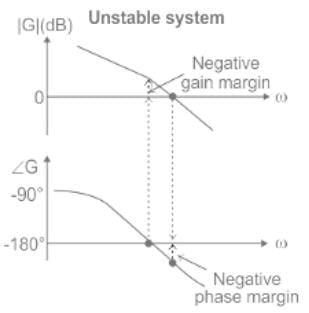
Phase Cross over Frequency:

  • The frequency at which the phase plot is having the phase of -180° is known as phase cross-over frequency.
  • It is denoted ωpc .
  • The unit of phase cross over frequency is rad/sec
     

Gain Cross over Frequency:

  • The frequency at which the magnitude plot is having the magnitude of zero dB is known as gain cross over frequency.
  • It is denoted by ωgc.
  • The unit of gain cross over frequency is rad/sec
     

Gain Margin:

Gain margin GM is defined as the negative of the magnitude in dB, at phase cross over frequency, i.e.

Mpc is the magnitude at phase cross over frequency. The unit of gain margin (GM) is dB.
Phase Margin
The phase margin of a system is defined as:
PM = 180° + ϕgc
The stability of the control system is based on the relation between gain margin and phase margin as:


Test: Bode Plot - 2 - Question 6

The transfer function of a system is 
The corner frequencies will be

Detailed Solution for Test: Bode Plot - 2 - Question 6

Bode plot transfer function is represented in standard time constant form as T(s) = 
ωc1, ωc2, … are corner frequencies.
In a Bode magnitude plot,

  • For a pole at the origin, the initial slope is -20 dB/decade
  • For a zero at the origin, the initial slope is 20 dB/decade
  • The slope of magnitude plot changes at each corner frequency
  • The corner frequency associated with poles causes a slope of -20 dB/decade
  • The corner frequency associated with poles causes a slope of -20 dB/decade
  • The final slope of Bode magnitude plot = (Z – P) × 20 dB/decade

Where Z is the number zeros and P is the number of poles

Application: The given transfer function is 

By comparing with the standard transfer function, corner frequencies are
ω1 = 2, ω2 = 5

Test: Bode Plot - 2 - Question 7

Bode plot is applicable for - 

Detailed Solution for Test: Bode Plot - 2 - Question 7

Bode plot:

  • In electrical engineering and control theory, a Bode plot is a graph of the frequency response of a system. It is usually a combination of a Bode magnitude plot, expressing the magnitude (usually in decibels) of the frequency response, and a Bode phase plot, expressing the phase shift.
  • The Bode magnitude plot is the graph of the function |H(s = jω)| of frequency ω (with j being the imaginary unit). The ω -axis of the magnitude plot is logarithmic and the magnitude is given in decibels, i.e., a value for the magnitude |H| is plotted on the axis at  20log10|H|
  • The Bode phase plot is the graph of the phase, commonly expressed in degrees, of the transfer function H(s = jω ) as a function of ω . The phase is plotted on the same logarithmic ω-axis as the magnitude plot, but the value for the phase is plotted on a linear vertical axis.
  • For many practical problems, the detailed Bode plots can be approximated with straight-line segments that are asymptotes of the precise response. Hence Bode plot as asymptotic plot.
  • Bode plot is applicable for minimum phase system.
     

Minimum Phase system:

  • A transfer function G(s) is minimum phase if both G(s) and 1/G(s) are causal and stable
  • A minimum phase system does not have zeros or poles on the right-half plane and it does not have delay.
  • Bode discovered that the phase can be uniquely derived from the slope of the magnitude for minimum-phase system.
  • We can draw Bode plot for non-minimum phase systems, but the magnitude and phase-angle plots are not 'uniquely related'.
  • For a Minimum phase system, the magnitude and phase-angle plots are uniquely related, that means if either one of them is specified over the entire frequency range, the other plot can be determined uniquely. This does not apply to NMP systems.
Test: Bode Plot - 2 - Question 8

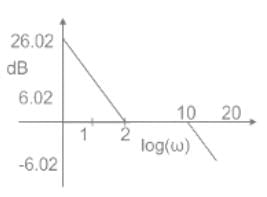
If the given system is connected to a unity negative feedback system, the steady-state error of a closed-loop system to a ramp input is;
Detailed Solution for Test: Bode Plot - 2 - Question 8

Concept- 
For a unity feedback system with an open-loop transfer function G(s), the steady-state errors can be found identify the system type and using the respective formula:
For system type 0 : ess = 1/1+Kp
For system type 1 : ess = 1/Kv
For system type 2 : ess = 1/Kα

By identifying the system type from the open-loop Bode plot, the steady-state error can be easily found as follows-


From the given bode plot initial slope = 

So one pole present at the origin
Since it is a type 1 system so it will intersect Real Axis at kv
Kv = 2
ess = 1/Kv = 1/2 = 0.5 

Test: Bode Plot - 2 - Question 9

The unit circle of the Nyquist plot transforms into unity or 0 dB line of the amplitude plot of the Bode diagram for

Detailed Solution for Test: Bode Plot - 2 - Question 9

The slope of magnitude plot of a Bode plot at any frequency is given by
Slope = (Z – P) × 20 dB/decade
Where, Z is the number of zeros at that frequency
P is the number of poles at that frequency
If a closed-loop pole of the system is on the jω axis, then the magnitude equals 1 and the phase is 180 degrees at that frequency. If that occurs, the Nyquist plot will pass through the -1 point at that frequency. It indicates that there are equal number of poles and zeros.
Therefore, the unit circle of the Nyquist plot transforms into 0 dB line of the amplitude plot of the Bode diagram at any frequency.

Test: Bode Plot - 2 - Question 10

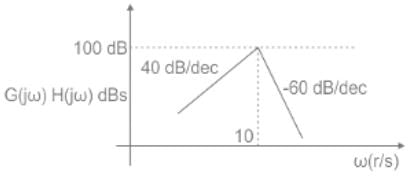
Which one of the following transfer functions represents the Bode plot as shown in the figure (where K is constant)?
Detailed Solution for Test: Bode Plot - 2 - Question 10

Concept:

In a bode magnitude plot, a pole adds a slope of -20 dB/decade whereas a zero adds a slope of 20 dB/decade.

The initial slope of the magnitude plot is ±20n dB/decade

+ for n zeros at origin

- for n poles at the origin

The standard transfer function of a Bode magnitude plot is:

Here, ω1, ω2, ω3, ω4, … are the corner frequencies.
n is the number poles at the origin.
Calculation:
The initial slope of Bode plot is +40 dB/ decade, so the transfer function will have two zeros 2 at origin.
The slope of Bode plot changes to -60 dB/ decade
Change in slope = -100 dB/decade
So, it will have 5 poles at ω = 10 rad/sec.
Now, the transfer function is 

25 docs|247 tests
Information about Test: Bode Plot - 2 Page
In this test you can find the Exam questions for Test: Bode Plot - 2 solved & explained in the simplest way possible. Besides giving Questions and answers for Test: Bode Plot - 2, EduRev gives you an ample number of Online tests for practice
Download as PDF