Test: Data Handling - 1 - Class 5 MCQ
10 Questions MCQ Test Math Olympiad for Class 5 - Test: Data Handling - 1

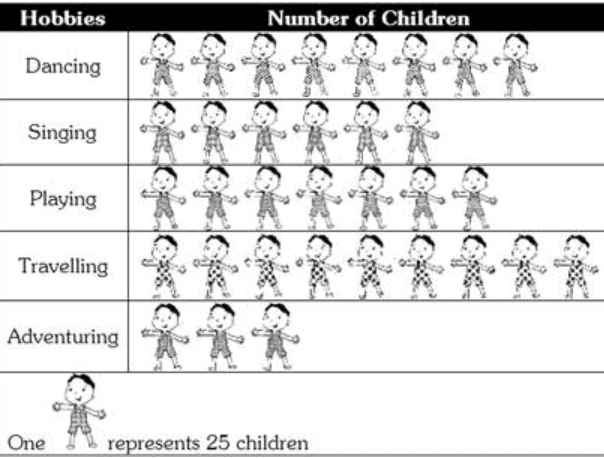
Find the number of children whose hobby is either travelling or adventuring?
| 1 Crore+ students have signed up on EduRev. Have you? Download the App |
The marks obtained in 4 subjects in an examination are 200. If the average of marks obtained in 3 subjects is 48, then how many marks are obtained in fourth subject?
If, ↑ represents 5 houses, then the number of houses represented by↑↑↑↑ are:
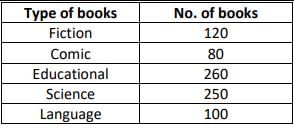
The following table shows the number of books in various categories in a kid’s library. From the table, there are _____ more books in the Fiction category than in the Language category.
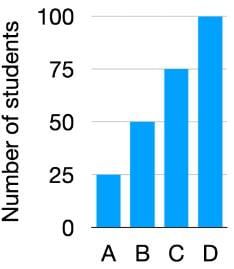
Examine the graph below carefully and answer the following questions. The graph depicts the results of a school’s students.
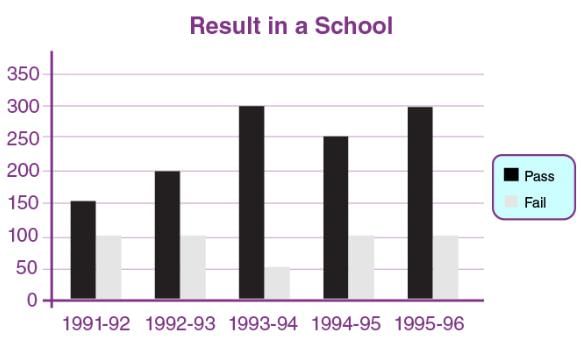
How many times have the same number of kids failed?
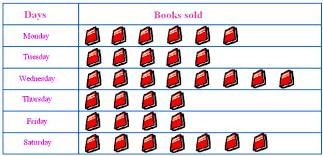
The bar graph given below shows the sales of books (in thousand number) from six branches of a publishing company during two consecutive years 2000 and 2001.
Sales of Books (in thousand numbers) from Six Branches - B1, B2, B3, B4, B5 and B6 of a publishing Company in 2000 and 2001.
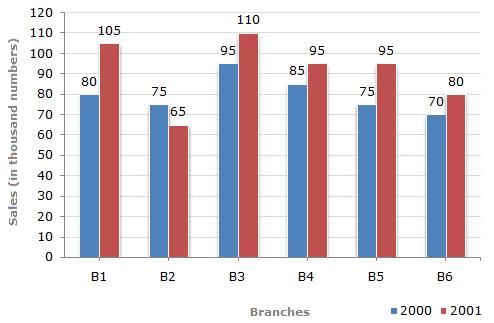
What is the average sales of all the branches (in thousand numbers) for the year 2000?
A graph drawn using rectangular bars is known as ________
|
32 videos|57 docs|45 tests
|
|
32 videos|57 docs|45 tests
|
Top Courses for Class 5


Important Questions for Data Handling - 1
Data Handling - 1 MCQs with Answers
Online Tests for Data Handling - 1 Math Olympiad for Class 5
|
© EduRev
|
Education Revolution
|


|


