Test: High Order Thinking Skills - 5 - Class 4 MCQ
10 Questions MCQ Test Mathematics Olympiad Class 4 - Test: High Order Thinking Skills - 5
| 1 Crore+ students have signed up on EduRev. Have you? Download the App |
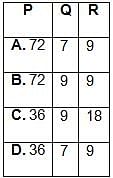
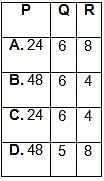
Fill in the blanks and select the CORRECT option.
- L.C.M. of 18 and 24 is P.
- Number of factors of 36 is Q.
- H.C.F. of 27 and 45 is R.
Fill in the blanks and select the CORRECT option.
- L.C.M. of 15 and 20 is P.
- Number of factors of 28 is Q.
- H.C.F. of 14 and 21 is R.
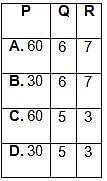
Fill in the blanks and select the CORRECT option.
- L.C.M. of 8 and 12 is P.
- Number of factors of 18 is Q.
- H.C.F. of 16 and 24 is R.
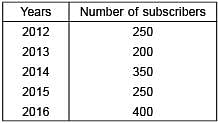
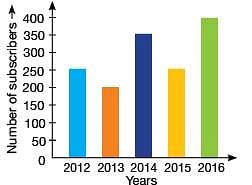
The following bar graph shows the number of subscribers a newspaper got every year.
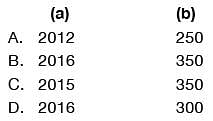
(a) In which year, newspaper got maximum subscribers?
(b) How many less newspapers were subscribed in 2012 than 2014 and 2015 together?
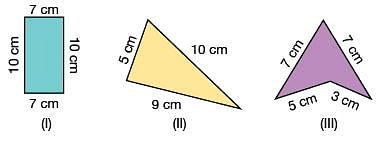
Arrange the given shapes in ascending order of their perimeters and select the CORRECT option.
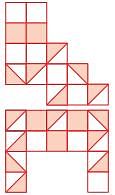
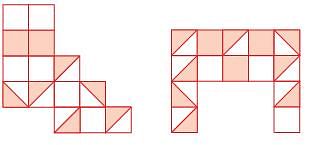
Find the sum of the shaded fractions of the given figures.
The given bar graph represents the milk flavours liked by the students of a class. Study the graph carefully ana answer the following questions.
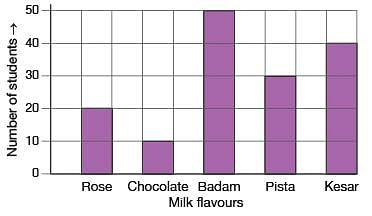
(a) Which milk flavour is liked by exactly 40 students?
(b) How many students likes Rose, Badam and Pista flavours altogether?
|
32 videos|39 docs|46 tests
|
|
32 videos|39 docs|46 tests
|


