CAT Exam  >  CAT Tests  >  Level-wise Tests for CAT  >  Test Level 1: Missing Data - CAT MCQ

Test Level 1: Missing Data - CAT MCQ


Test Description

15 Questions MCQ Test Level-wise Tests for CAT - Test Level 1: Missing Data

Test Level 1: Missing Data for CAT 2024 is part of Level-wise Tests for CAT preparation. The Test Level 1: Missing Data questions and answers have been prepared according to the CAT exam syllabus.The Test Level 1: Missing Data MCQs are made for CAT 2024 Exam. Find important definitions, questions, notes, meanings, examples, exercises, MCQs and online tests for Test Level 1: Missing Data below.
Solutions of Test Level 1: Missing Data questions in English are available as part of our Level-wise Tests for CAT for CAT & Test Level 1: Missing Data solutions in Hindi for Level-wise Tests for CAT course. Download more important topics, notes, lectures and mock test series for CAT Exam by signing up for free. Attempt Test Level 1: Missing Data | 15 questions in 30 minutes | Mock test for CAT preparation | Free important questions MCQ to study Level-wise Tests for CAT for CAT Exam | Download free PDF with solutions
Test Level 1: Missing Data - Question 1

Directions: Study the following information and answer the question that follows.

The table below shows the percentage profit or loss of five different commodities based on the sum of cost price and shipping cost.
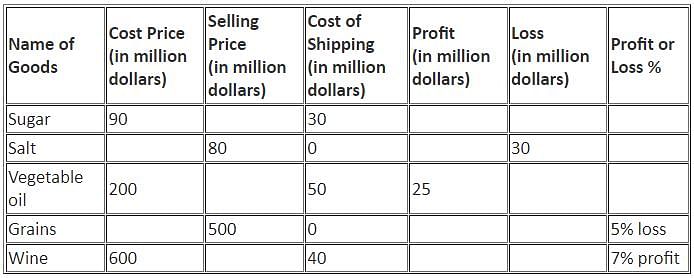
Q. What is the Percentage of the Selling price of vegatable oil and cost price of salt ?

Detailed Solution for Test Level 1: Missing Data - Question 1

Selling price of Vegetable oil = 200 + 50 + 25 = $275 million
Cost price of salt = Selling price + Loss = 80 + 30 = $110 million
Therefore, required percentage = 275/110 x 110 = 250%

Test Level 1: Missing Data - Question 2

Directions: Study the following information and answer the question that follows.

The table below shows the percentage profit or loss of five different commodities based on the sum of cost price and shipping cost.
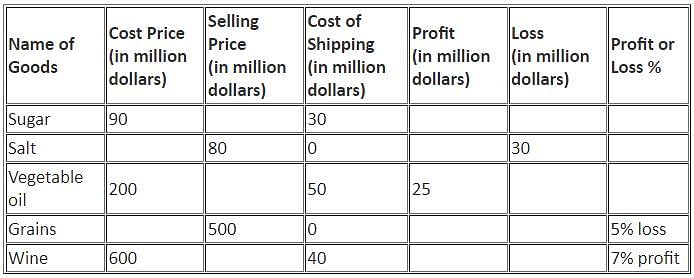
Q. What is the difference between the selling price of Wine and that of Vegetable oil?

Detailed Solution for Test Level 1: Missing Data - Question 2

Total cost price of Wine = 600 + 40 = $640 million
Selling price of Wine = 100 + Profit Percent/100 x CP
= 100 + 7/100 x 640 = $684.8 million
Selling price of Vegetable oil = 200 + 50 + 25 = $275 million
Therefore, required difference = 684.8 - 275 = $409.8 million

1 Crore+ students have signed up on EduRev. Have you? Download the App
Test Level 1: Missing Data - Question 3

Directions: Study the following information and answer the question that follows.

The table below shows the percentage profit or loss of five different commodities based on the sum of cost price and shipping cost.

Q. What is the ratio of the loss on Grains to that on Salt?

Detailed Solution for Test Level 1: Missing Data - Question 3

Cost price of Grains = 100/100 - Loss Percent x SP
= 100/100 -5 x 500 = 100/95 x 500 million
Loss on Grains = CP of Grains - SP of Grains = 50000/95 - 500 = 2500/95 million

Loss on Salt = $30 million

Therefore, required ratio = 2500/95 : 30 = 50 : 57

Test Level 1: Missing Data - Question 4

Directions: Study the given information and answer the following question.
The table given below shows the estimated cost (in Rs. lakh) of a project of laying a railway line between two places, the project began in 1988 and was completed in 1991.

Q. How many times approximately was the total cost of materials to the total labour cost for all the years?

Detailed Solution for Test Level 1: Missing Data - Question 4

Total material cost = (95 + 80 + 75 + 70 + 45 + 60 + 15 + 12 + 16 + 25 + 18 + 21) = 532
Total labour cost = (2.1 + 25 + 20 + 18) = 65.1
Therefore, total material cost was approximately 8 times the total labour cost.

Test Level 1: Missing Data - Question 5

Directions: Study the given information and answer the following question.
The table given below shows the estimated cost (in Rs. lakh) of a project of laying a railway line between two places, the project began in 1988 and was completed in 1991.

Q. The total expenditure was required to be kept within Rs. 700 lakh by cutting the expenditure on administration equally in all the years. What was the percentage cut on administration expenditure for the year 1989?

Detailed Solution for Test Level 1: Missing Data - Question 5

Total expenditure = 52.1 + 267.5 + 196.4 + 209.5 = Rs. 725.5 lakh
If total expenditure was to be kept within 700 lakh, it had to be reduced by Rs. 25.5 lakh
So, the expenditure reduced each year would have been (25.5/4) = Rs. 6.375 lakh
Hence, percentage cut for 1989 = (6.375/15) × 100 = 42.5%

Test Level 1: Missing Data - Question 6

Directions: Study the given information and answer the following question.
The table given below shows the estimated cost (in Rs. lakh) of a project of laying a railway line between two places, the project began in 1988 and was completed in 1991.

Q. If the length of line to be laid each year was in proportion to the estimated cost for material and labour, what fraction of the total length was proposed to be completed by the third year?

Detailed Solution for Test Level 1: Missing Data - Question 6

Costs of material and labour in:
1988 = Rs. 2.1 lakh
1989 = 95 + 70 + 15 + 25 + 25 = Rs. 230 lakh
1990 = 80 + 45 + 12 + 18 + 20 = Rs. 175 lakh
1991 = 75 + 60 + 16 + 21 + 18 = Rs. 190 lakh
Therefore, fraction of the total length proposed to be completed by the third year = (2.1 + 230 + 175)/(2.1 + 230 + 175 + 190) = 0.7

Test Level 1: Missing Data - Question 7

Directions: Study the following information carefully and answer the question given below.
Table shows income, increment percentage, expenses and saving details of three employees for three years (2015, 2016 and 2017).
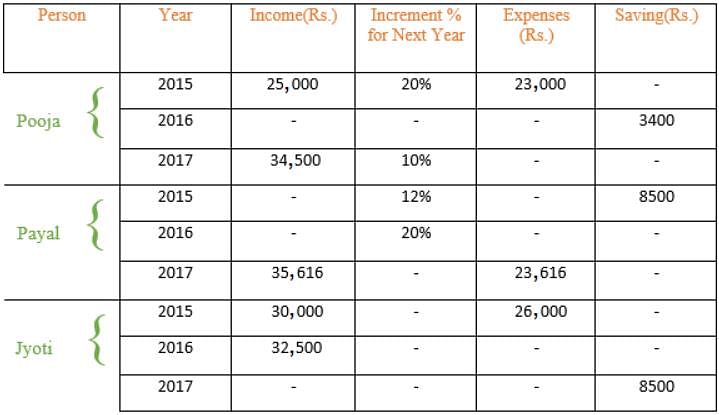
Q. If the difference between the expenses and savings of Jyoti in 2017 is Rs. 16,750, then what is the increment percentage in the total income of Jyoti from 2015 to 2017?

Detailed Solution for Test Level 1: Missing Data - Question 7

Expenses of Jyoti in 2017 = Rs. (8500 + 16,750) = Rs. 25,250
Income of Jyoti in 2017 = Rs. (25,250 + 8500) = Rs. 33,750
Income of Jyoti in 2015 = Rs. 30,000

Increment percentage = 33750 - 30000/30000 x 100 = 12.5%

Test Level 1: Missing Data - Question 8

Directions: Study the following information carefully and answer the question given below.
Table shows income, increment percentage, expenses and saving details of three employees for three years (2015, 2016 and 2017).
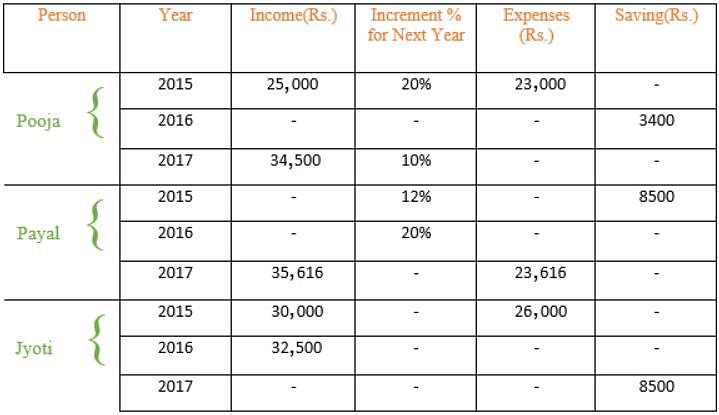
Q. If the income of Pooja in 2015 is doubled and the percentage increment of Pooja in the year 2016 is also doubled, then what is the income of Pooja in 2017?

Detailed Solution for Test Level 1: Missing Data - Question 8

Income of Pooja in 2015 = Rs. 25,000
Income of Pooja in 2016 = 120% of Rs. 25,000 = Rs. 30,000
Income of Pooja in 2017 = Rs. 34,500
% increment in 2016 = [(34,500 - 30,000)/30,000] × 100 = 15%
Now, after changing the value of increment in 2016 and income in 2015 of Pooja as per the question,
Income of Pooja in 2015 = Rs. 25,000 × 2 = Rs. 50,000
Income of Pooja in 2016 = Rs. 50,000 × 120/100 = Rs. 60,000
Income of Pooja in 2017 = Rs. 60,000 × 130/100 = Rs. 78,000
Hence, the income of Pooja in 2017 is Rs. 78,000.

Test Level 1: Missing Data - Question 9

Directions: Study the following information carefully and answer the question given below.
Table shows income, increment percentage, expenses and saving details of three employees for three years (2015, 2016 and 2017).
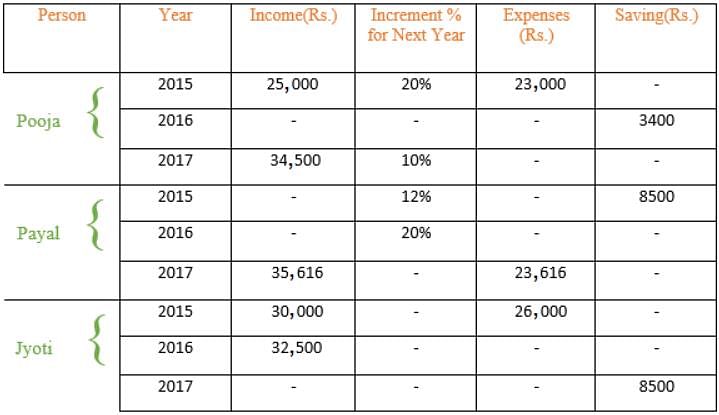
Q. Income of Pooja in 2016 is approximately what percentage more/less than the average income of Pooja?

Detailed Solution for Test Level 1: Missing Data - Question 9

Income of Pooja in 2015 = Rs. 25,000
Income of Pooja in 2016 = Rs. 25,000 × 120/100 = Rs. 30,000
Income of Pooja in 2017 = Rs. 34,500
Average income of Pooja = Rs. (25,000 + 30,000 + 34,500)/3 = Rs. 29,833.3

Required percentage = 30,000/29,833.3 x 100 = 100.56

Hence, income of Pooja in 2016 is approximately 0.56% more than average income of Pooja.

Test Level 1: Missing Data - Question 10

Directions: Study the following information carefully and answer the question given below.
Table shows income, increment percentage, expenses and saving details of three employees for three years (2015, 2016 and 2017).
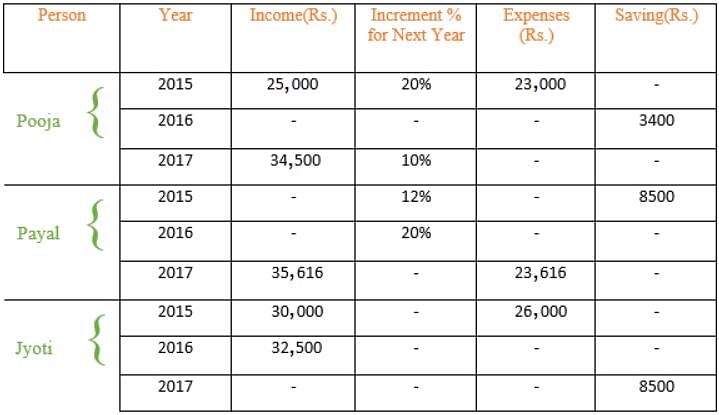
Q. If the income of Pooja in 2015 is doubled and the percentage increment of Pooja in the year 2016 is also doubled, then what is the income of Pooja in 2017?

Detailed Solution for Test Level 1: Missing Data - Question 10

Income of Pooja in 2015 = Rs. 25,000
Income of Pooja in 2016 = 120% of Rs. 25,000 = Rs. 30,000
Income of Pooja in 2017 = Rs. 34,500
% increment in 2016 = [(34,500 - 30,000)/30,000] × 100 = 15%
Now, after changing the value of increment in 2016 and income in 2015 of Pooja as per the question,
Income of Pooja in 2015 = Rs. 25,000 × 2 = Rs. 50,000
Income of Pooja in 2016 = Rs. 50,000 × 120/100 = Rs. 60,000
Income of Pooja in 2017 = Rs. 60,000 × 130/100 = Rs. 78,000
Hence, the income of Pooja in 2017 is Rs. 78,000.

Test Level 1: Missing Data - Question 11

Directions: Study the table given below and answer the following question.
Distribution of washing machines in different cities and among different categories of people of Telangana is as follows:
(Total washing machines distributed = 30 lakh)
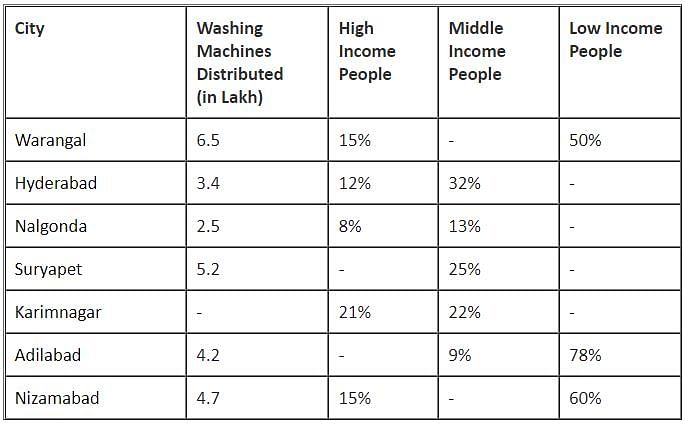
Q. What is the difference between total distribution of washing machines in Warangal and total distribution of washing machines in Karimnagar and Adilabad together?

Detailed Solution for Test Level 1: Missing Data - Question 11

Washing machine distribution in Warangal = 6.5 lakh
Washing machine distribution in Karimnagar = 30 - (6.5 + 3.4 + 2.5 + 5.2 + 4.2 + 4.7) = 3.5 lakh
Washing machine distribution in Adilabad = 4.2 lakh
Washing machine distribution in Karimnagar and Adilabad together = 3.5 + 4.2 = 7.7 lakh
Required answer = (7.7 - 6.5) lakh = 1,20,000

Test Level 1: Missing Data - Question 12

Directions: Study the table given below and answer the following question.
Distribution of washing machines in different cities and among different categories of people of Telangana is as follows:
(Total washing machines distributed = 30 lakh)
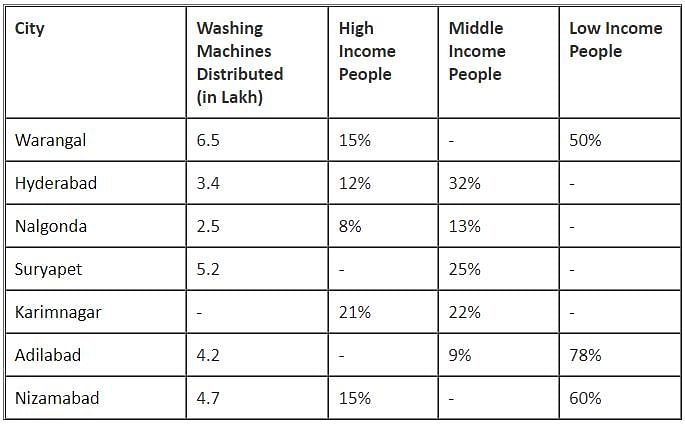
Q. In Suryapet city, the ratio of percent distribution of Washing Machines among high income people to that among low income people is 2 : 3. Then, how much more is the distribution of Washing Machines among high income people in the same city than that among middle income people?

Detailed Solution for Test Level 1: Missing Data - Question 12

In Suryapet, High income people + Low income people = 100 - 25 = 75%
High income people : Low income people = 2 : 3
So, High income people % = 2/5 × 75 = 30%
Low income people % = 3/5 × 75 = 45%

Middle income people % = 25% (given)

Required answer = 5.2 × 30 - 25/100 = 0.26 lakh = 26,000

Test Level 1: Missing Data - Question 13

Directions: Study the table given below and answer the following question.
Distribution of washing machines in different cities and among different categories of people of Telangana is as follows:
(Total washing machines distributed = 30 lakh)
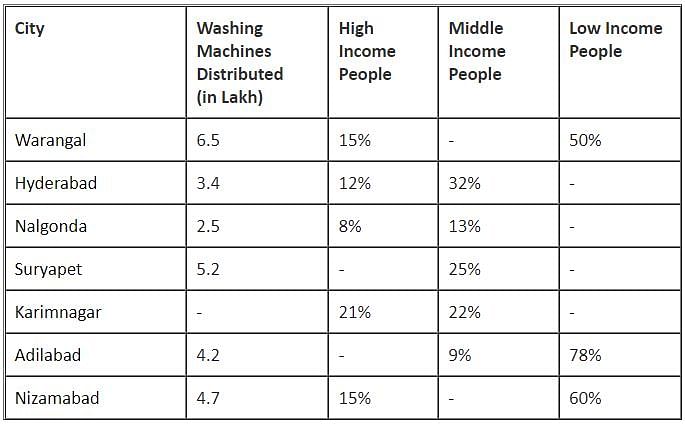
Q. What is the difference between the number of Washing Machines distributed among high income people of Nalgonda, Warangal and Nizamabad together and that distributed among middle income people of Suryapet, Karimnagar and Nizamabad together?

Detailed Solution for Test Level 1: Missing Data - Question 13

Number of Washing Machines distributed among high income people of Nalgonda, Warangal and Nizamabad

= 2.5 × 8/100 + 6.5 x 15/100 + 4.7 x 15/100 = 1.88 lakh

Number of Washing Machines distributed among middle income people of Suryapet, Karimnagar and Nizamabad

= 5.2 × 25/100 + 3.5 × 22/100 + 4.7 × 25/100 = 3.245 lakh

Difference = (3.245 - 1.88) lakh = 1.365 lakh = 1,36,500

Test Level 1: Missing Data - Question 14

Directions: Study the following graph carefully and answer the question that follows:
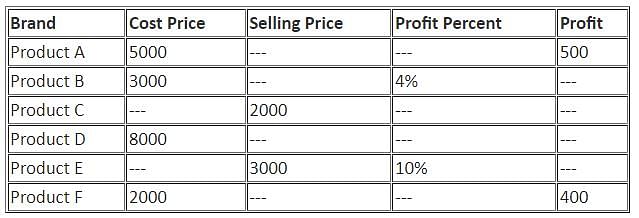
Q. What is the profit or loss % of product C if cost price of product C is half the cost price of product D?

Detailed Solution for Test Level 1: Missing Data - Question 14

Cost price of product D = Rs. 8000
Therefore, cost price of product C = Rs. 4000
Loss of product C = 4000 - 2000 = Rs. 2000
Loss percent of product C = (2000/4000) × 100 = 50%

Test Level 1: Missing Data - Question 15

Directions: Study the following graph carefully and answer the question that follows:

Q. What is the profit of product B?

Detailed Solution for Test Level 1: Missing Data - Question 15

Profit of product B = 3000 × 0.04 = Rs. 120

5 docs|272 tests
Information about Test Level 1: Missing Data Page
In this test you can find the Exam questions for Test Level 1: Missing Data solved & explained in the simplest way possible. Besides giving Questions and answers for Test Level 1: Missing Data, EduRev gives you an ample number of Online tests for practice

Top Courses for CAT

Download as PDF

Top Courses for CAT