Test: Line & Bar Charts - 2 (July 4) - CAT MCQ
10 Questions MCQ Test Daily Test for CAT Preparation - Test: Line & Bar Charts - 2 (July 4)
Directions for Question: Answer the questions on the basis of the information given below. There are ten real numbers A, B, C, D, E, F, G, H, I. Differences between any two of them are given in the diagram below.
(2014)
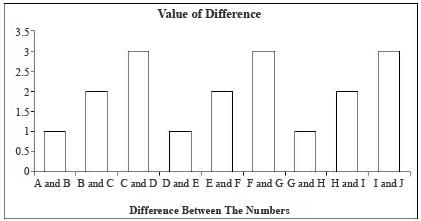
Q. If the value of A is known then how many distinct values are possible for J?

Directions for Question: Answer the questions on the basis of the information given below.
There are ten real numbers A, B, C, D, E, F, G, H, I. Differences between any two of them are given in the diagram below.
(2014)

Q. If all the 10 numbers from A to J are positive integers then at least how many of them are even?

Directions for Question: Answer the questions on the basis of the information given below. There are ten real numbers A, B, C, D, E, F, G, H, I. Differences between any two of them are given in the diagram below.
(2014)

Q. If all the 10 numbers from A to J are positive integers and A is equal to 1 then at a time at most how many of them can be perfect squares?

Directions for Question: Answer the questions on the basis of the information given below.
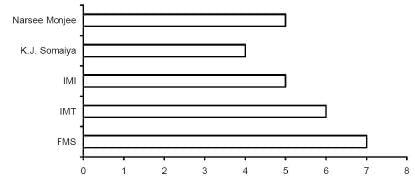
The average annual salary figures of five leading B-schools have been shown below.
Average Annual Salary (₹ in lakh)
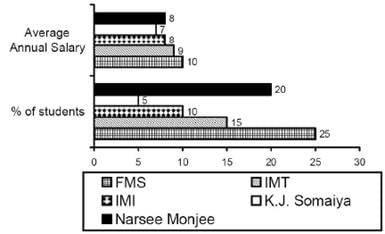
The percentage of students getting PPOs (Pre-Placement offers) and their average annual salary in lakhs is shown below:
The number of students, the number of companies visiting the campus and total offers made (including PPO’s) have been shown below for these five leading B-schools.
(2014)
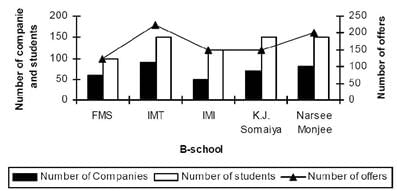
Q. Which school has the highest total number of offers per student?
Directions for Question: Answer the questions on the basis of the information given below.
The average annual salary figures of five leading B-schools have been shown below.
Average Annual Salary (₹ in lakh)

The percentage of students getting PPOs (Pre-Placement offers) and their average annual salary in lakhs is shown below:

The number of students, the number of companies visiting the campus and total offers made (including PPO’s) have been shown below for these five leading B-schools.
(2014)
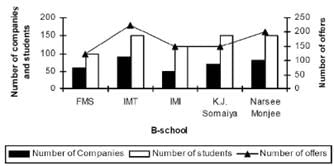
Q. The ratio of number of offers to the number of companies visiting the campus is highest for:
Directions for Question: Answer the questions on the basis of the information given below.
The average annual salary figures of five leading B-schools have been shown below.
Average Annual Salary (₹ in lakh)

The percentage of students getting PPOs (Pre-Placement offers) and their average annual salary in lakhs is shown below:

The number of students, the number of companies visiting the campus and total offers made (including PPO’s) have been shown below for these five leading B-schools.
(2014)

Q. At FMS, what is the average salary of students, who did not get a PPO?
Directions for Question: Answer the questions on the basis of the information given below.
The graphs given below show the revenues and profits of four IT education companies.
Profitability = (Profit/Revenue)
(2014)
Total cost = Revenue – Profit Revenues
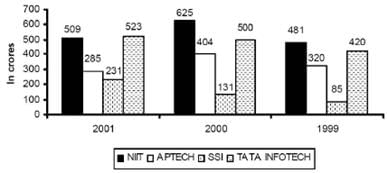
Profits
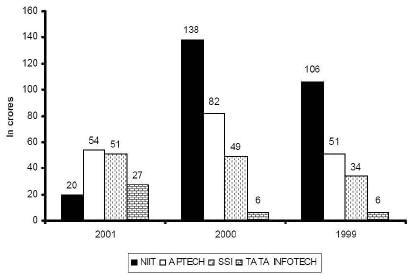
Q. In 1999, how many companies have a profitability less than the average of the profitabilities of the four companies?
Directions for Question: Answer the questions on the basis of the information given below.
The graphs given below show the revenues and profits of four IT education companies.
Profitability = (Profit/Revenue)
(2014)
Total cost = Revenue – Profit Revenues

Profits

Q. In 2002, if the cost in each company increased by 10% over 2001 and the revenue for each company decreased by 10% over 2001, what is the approximate profitability of all the companies taken together in 2002?
Directions for Question: Answer the questions on the basis of the information given below.
The graphs given below show the revenues and profits of four IT education companies.
Profitability = (Profit/Revenue)
(2014)
Total cost = Revenue – Profit Revenues

Profits

Q. Arrange the companies in increasing order of their profitability in 2001.
Directions for Question: Answer the questions on the basis of the information given below.
The graphs given below show the revenues and profits of four IT education companies.
Profitability = (Profit/Revenue)
(2014)
Total cost = Revenue – Profit Revenues

Profits

Q. Which company has the highest profitability in 2000?
|
152 docs|327 tests
|


