Bank Exams Exam  >  Bank Exams Tests  >  Data Interpretation for Competitive Examinations  >  Test: Missing Data Interpretation - Bank Exams MCQ

Test: Missing Data Interpretation - Bank Exams MCQ


Test Description

10 Questions MCQ Test Data Interpretation for Competitive Examinations - Test: Missing Data Interpretation

Test: Missing Data Interpretation for Bank Exams 2025 is part of Data Interpretation for Competitive Examinations preparation. The Test: Missing Data Interpretation questions and answers have been prepared according to the Bank Exams exam syllabus.The Test: Missing Data Interpretation MCQs are made for Bank Exams 2025 Exam. Find important definitions, questions, notes, meanings, examples, exercises, MCQs and online tests for Test: Missing Data Interpretation below.
Solutions of Test: Missing Data Interpretation questions in English are available as part of our Data Interpretation for Competitive Examinations for Bank Exams & Test: Missing Data Interpretation solutions in Hindi for Data Interpretation for Competitive Examinations course. Download more important topics, notes, lectures and mock test series for Bank Exams Exam by signing up for free. Attempt Test: Missing Data Interpretation | 10 questions in 10 minutes | Mock test for Bank Exams preparation | Free important questions MCQ to study Data Interpretation for Competitive Examinations for Bank Exams Exam | Download free PDF with solutions
Test: Missing Data Interpretation - Question 1

Directions: Study the following information carefully and answer the questions given beside:
A company Airtel Limited arranges a training programme for its employees from Marketing, Finance and HRD Departments. Each participant is awarded a grade at the end of the training programme.
The total number of employees of the Finance Department participating in the programme is twice the number of candidate of HRD Department who have secured ‘Above Average’ grade. The total number of candidates who have obtained ‘Average grade’, is six times the number of candidates of the Marketing Department who have obtained ‘Excellent’ grade and the number of candidates of the HRD Department with ‘Above Average’ grade is 1/3rd the total number of candidates of the HRD Department. Your superior has given you an incomplete chart to be completed
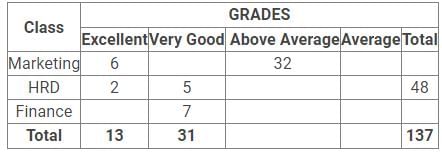
Q. The total number of employees getting an Above Average grade is:

Detailed Solution for Test: Missing Data Interpretation - Question 1

Following the common explanation, we get

From the above table, we get

∴   Total number of above average grade employees = 57

Hence, option A is correct.

Common Explanation:
Number of HRD employees given an above average grade = 1/3rd of the total number of employees in HRD
 ∴ Number of employees from HRD given an above average grade = (1/3) × 48 = 16
 Total number of employees given an average grade = 6 × Number of employees from Marketing department given an Excellent grade
∴ Total number of Average grade employees = 6 × 6 = 36
Total number of participating employees from Finance Department = 2 × Number of above average grade employees from HRD
∴ Total number of participating employees from the Finance Department = 2 × 16 = 32
Total Number of participating employees = (Number of Excellent grade employees) + (Number of Very good grade employees) + (Number of above Average grade employees) + (Number of Average grade employees)
∴ 137 = 13 + 31 + Number of above average grade employees + 36
∴ Total number of above average grade employees = 57
Total number of excellent grade employees = Sum of the number of Excellent grade employees from Marketing, HRD and Finance department
Doing the above for each grade we get.
Number of excellent grade employees in Finance department = 15
Number of very good grade employees in Marketing department = 19
Number of above average grade employees in Finance department = 9
Total number of participants = sum of the number of participants from all branches
∴   137 = Number of employees in Marketing department + 48 + 32
∴ Total number of employees in Marketing department = 57
Number of Excellent + very good + above average + average employees in every department = Total number of participating employees in respective department
From this, we get that the average grade employees in Marketing, HRD and Finance Departments are 0, 25 and 11 respectively.
From the above information, we complete the table as follows

Test: Missing Data Interpretation - Question 2

Directions: Study the following information carefully and answer the questions given beside:
A company Airtel Limited arranges a training programme for its employees from Marketing, Finance and HRD Departments. Each participant is awarded a grade at the end of the training programme.
The total number of employees of the Finance Department participating in the programme is twice the number of candidate of HRD Department who have secured ‘Above Average’ grade. The total number of candidates who have obtained ‘Average grade’, is six times the number of candidates of the Marketing Department who have obtained ‘Excellent’ grade and the number of candidates of the HRD Department with ‘Above Average’ grade is 1/3rd the total number of candidates of the HRD Department. Your superior has given you an incomplete chart to be completed

Q. The number of employees of the Marketing Department getting ‘Above Average’ grade form what percent of the total number of employees participating in the programme?

Detailed Solution for Test: Missing Data Interpretation - Question 2

Following the common explanation, we get

From  the above table, we get
Number of employees from Marketing Department getting an above average grade = 32
∴  % out of total number of participating employees = (32/137) × 100
∴  Required % = 23.36%
Hence, option B is correct.
Common Explanation:
Number of HRD employees given an above average grade = 1/3rd of the total number of employees in HRD
 ∴ Number of employees from HRD given an above average grade = (1/3) × 48 = 16
 Total number of employees given an average grade = 6 × Number of employees from Marketing department given an Excellent grade
∴ Total number of Average grade employees = 6 × 6 = 36
Total number of participating employees from Finance Department = 2 × Number of above average grade employees from HRD
∴ Total number of participating employees from the Finance Department = 2 × 16 = 32
Total Number of participating employees = (Number of Excellent grade employees) + (Number of Very good grade employees) + (Number of above Average grade employees) + (Number of Average grade employees)
∴ 137 = 13 + 31 + Number of above average grade employees + 36
∴ Total number of above average grade employees = 57
Total number of excellent grade employees = Sum of the number of Excellent grade employees from Marketing, HRD and Finance department
Doing the above for each grade we get.
Number of excellent grade employees in Finance department = 15
Number of very good grade employees in Marketing department = 19
Number of above average grade employees in Finance department = 9
Total number of participants = sum of the number of participants from all branches
∴   137 = Number of employees in Marketing department + 48 + 32
∴ Total number of employees in Marketing department = 57
Number of Excellent + very good + above average + average employees in every department = Total number of participating employees in respective department
From this, we get that the average grade employees in Marketing, HRD and Finance Departments are 0, 25 and 11 respectively.
From the above information, we complete the table as follows

Test: Missing Data Interpretation - Question 3

Directions: Study the following information carefully and answer the questions given beside:
A company Airtel Limited arranges a training programme for its employees from Marketing, Finance and HRD Departments. Each participant is awarded a grade at the end of the training programme.
The total number of employees of the Finance Department participating in the programme is twice the number of candidate of HRD Department who have secured ‘Above Average’ grade. The total number of candidates who have obtained ‘Average grade’, is six times the number of candidates of the Marketing Department who have obtained ‘Excellent’ grade and the number of candidates of the HRD Department with ‘Above Average’ grade is 1/3rd the total number of candidates of the HRD Department. Your superior has given you an incomplete chart to be completed

Q. The number of employees of the HRD Department getting ‘Above Average’ grade form approximately what percent of the total number of employees participating in the programme?

Detailed Solution for Test: Missing Data Interpretation - Question 3

Following the common explanation, we get

From the above table, we get
∴ % out of total number of participating employees = (16/137) × 100
∴ required % = 11.678 ≈ 12 %
Hence, option D is correct.

Common Explanation:
Number of HRD employees given an above average grade = 1/3rd of the total number of employees in HRD
 ∴ Number of employees from HRD given an above average grade = (1/3) × 48 = 16
 Total number of employees given an average grade = 6 × Number of employees from Marketing department given an Excellent grade
∴ Total number of Average grade employees = 6 × 6 = 36
Total number of participating employees from Finance Department = 2 × Number of above average grade employees from HRD
∴ Total number of participating employees from the Finance Department = 2 × 16 = 32
Total Number of participating employees = (Number of Excellent grade employees) + (Number of Very good grade employees) + (Number of above Average grade employees) + (Number of Average grade employees)
∴ 137 = 13 + 31 + Number of above average grade employees + 36
∴ Total number of above average grade employees = 57
Total number of excellent grade employees = Sum of the number of Excellent grade employees from Marketing, HRD and Finance department
Doing the above for each grade we get.
Number of excellent grade employees in Finance department = 15
Number of very good grade employees in Marketing department = 19
Number of above average grade employees in Finance department = 9
Total number of participants = sum of the number of participants from all branches
∴   137 = Number of employees in Marketing department + 48 + 32
∴ Total number of employees in Marketing department = 57
Number of Excellent + very good + above average + average employees in every department = Total number of participating employees in respective department
From this, we get that the average grade employees in Marketing, HRD and Finance Departments are 0, 25 and 11 respectively.
From the above information, we complete the table as follows

Test: Missing Data Interpretation - Question 4

Directions: Study the following information carefully and answer the questions given beside:
A company Airtel Limited arranges a training programme for its employees from Marketing, Finance and HRD Departments. Each participant is awarded a grade at the end of the training programme.
The total number of employees of the Finance Department participating in the programme is twice the number of candidate of HRD Department who have secured ‘Above Average’ grade. The total number of candidates who have obtained ‘Average grade’, is six times the number of candidates of the Marketing Department who have obtained ‘Excellent’ grade and the number of candidates of the HRD Department with ‘Above Average’ grade is 1/3rd the total number of candidates of the HRD Department. Your superior has given you an incomplete chart to be completed

Q. The least number of employees getting ‘Average’ grade, are from

Detailed Solution for Test: Missing Data Interpretation - Question 4

Following the common explanation, we get

From the above table, we get
∴   Marketing department has the least number of Average grade Employees.
Hence, option A is correct.

Common Explanation:
Number of HRD employees given an above average grade = 1/3rd of the total number of employees in HRD
 ∴ Number of employees from HRD given an above average grade = (1/3) × 48 = 16
 Total number of employees given an average grade = 6 × Number of employees from Marketing department given an Excellent grade
∴ Total number of Average grade employees = 6 × 6 = 36
Total number of participating employees from Finance Department = 2 × Number of above average grade employees from HRD
∴ Total number of participating employees from the Finance Department = 2 × 16 = 32
Total Number of participating employees = (Number of Excellent grade employees) + (Number of Very good grade employees) + (Number of above Average grade employees) + (Number of Average grade employees)
∴ 137 = 13 + 31 + Number of above average grade employees + 36
∴ Total number of above average grade employees = 57
Total number of excellent grade employees = Sum of the number of Excellent grade employees from Marketing, HRD and Finance department
Doing the above for each grade we get.
Number of excellent grade employees in Finance department = 15
Number of very good grade employees in Marketing department = 19
Number of above average grade employees in Finance department = 9
Total number of participants = sum of the number of participants from all branches
∴   137 = Number of employees in Marketing department + 48 + 32
∴ Total number of employees in Marketing department = 57
Number of Excellent + very good + above average + average employees in every department = Total number of participating employees in respective department
From this, we get that the average grade employees in Marketing, HRD and Finance Departments are 0, 25 and 11 respectively.
From the above information, we complete the table as follows

Test: Missing Data Interpretation - Question 5

Directions: Study the following information carefully and answer the questions given beside:
A company Airtel Limited arranges a training programme for its employees from Marketing, Finance and HRD Departments. Each participant is awarded a grade at the end of the training programme.
The total number of employees of the Finance Department participating in the programme is twice the number of candidate of HRD Department who have secured ‘Above Average’ grade. The total number of candidates who have obtained ‘Average grade’, is six times the number of candidates of the Marketing Department who have obtained ‘Excellent’ grade and the number of candidates of the HRD Department with ‘Above Average’ grade is 1/3rd the total number of candidates of the HRD Department. Your superior has given you an incomplete chart to be completed

Q. The company Airtel is charged Rs. 5,570/ - per employee towards the cost of training. If it is offered a discount of 7.5% to those candidates who secured ‘Average’ grade, them, what is the total fee payable by company Airtel to the training company, to the nearest thousand?

Detailed Solution for Test: Missing Data Interpretation - Question 5

Following the common explanation, we get

From the above table, we get
Total number of Average grade employees in Airtel = 0 + 25 + 11 = 36
Number of employees from Airtel getting a grade except Average grade = 137 – 36 = 101
∴ Total cost payable = 36 × discounted amount + 101 × 5570
∴ Total cost payable = 36 × 5152.25 + 101 × 5570
∴ Total cost payable = 1,85,481 + 5,62,570 = 7,48,051
∴ The payable cost rounded to the nearest thousand is Rs .7,48,000
Hence, option C is correct.

Common Explanation:
Number of HRD employees given an above average grade = 1/3rd of the total number of employees in HRD
 ∴ Number of employees from HRD given an above average grade = (1/3) × 48 = 16
 Total number of employees given an average grade = 6 × Number of employees from Marketing department given an Excellent grade
∴ Total number of Average grade employees = 6 × 6 = 36
Total number of participating employees from Finance Department = 2 × Number of above average grade employees from HRD
∴ Total number of participating employees from the Finance Department = 2 × 16 = 32
Total Number of participating employees = (Number of Excellent grade employees) + (Number of Very good grade employees) + (Number of above Average grade employees) + (Number of Average grade employees)
∴ 137 = 13 + 31 + Number of above average grade employees + 36
∴ Total number of above average grade employees = 57
Total number of excellent grade employees = Sum of the number of Excellent grade employees from Marketing, HRD and Finance department
Doing the above for each grade we get.
Number of excellent grade employees in Finance department = 15
Number of very good grade employees in Marketing department = 19
Number of above average grade employees in Finance department = 9
Total number of participants = sum of the number of participants from all branches
∴   137 = Number of employees in Marketing department + 48 + 32
∴ Total number of employees in Marketing department = 57
Number of Excellent + very good + above average + average employees in every department = Total number of participating employees in respective department
From this, we get that the average grade employees in Marketing, HRD and Finance Departments are 0, 25 and 11 respectively.
From the above information, we complete the table as follows

Test: Missing Data Interpretation - Question 6

Directions: Study the following table and answer the questions based on it.
Expenditures of a Company (in Lakh Rupees) per Annum Over the given Years.
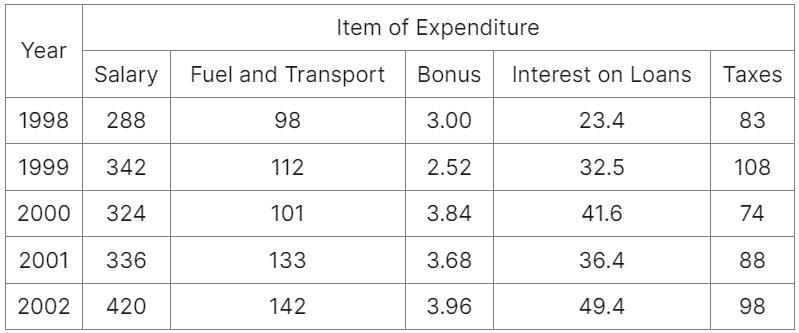
Q. What is the average amount of interest per year which the company had to pay during this period?

Detailed Solution for Test: Missing Data Interpretation - Question 6

Average amount of interest paid by the Company during the given period

= Rs. 36.66 lakhs.

Test: Missing Data Interpretation - Question 7

Directions: Study the following table and answer the questions based on it.
Expenditures of a Company (in Lakh Rupees) per Annum Over the given Years.
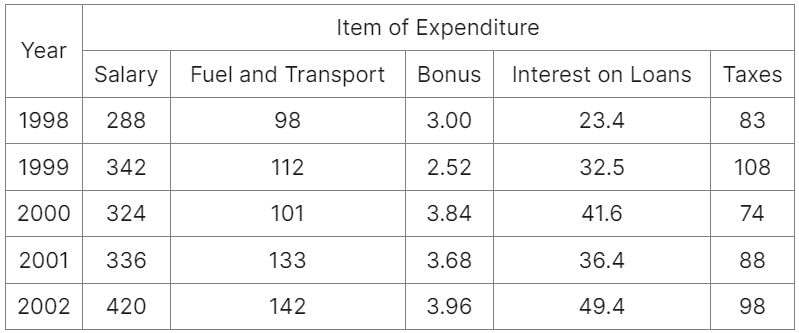
Q. The total amount of bonus paid by the company during the given period is approximately what percent of the total amount of salary paid during this period?

Detailed Solution for Test: Missing Data Interpretation - Question 7

Required percentage =


= 1%.

Test: Missing Data Interpretation - Question 8

Directions: Study the following table and answer the questions based on it.
Expenditures of a Company (in Lakh Rupees) per Annum Over the given Years.
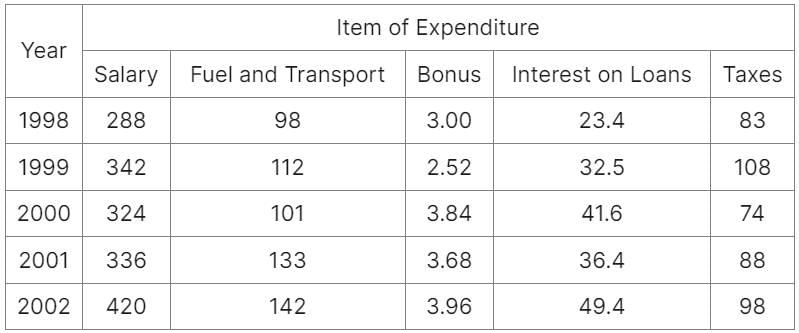
Q. The total expenditure of the company over these items during the year 2000 is?

Detailed Solution for Test: Missing Data Interpretation - Question 8

Total expenditure of the Company during 2000
= Rs. (324 + 101 + 3.84 + 41.6 + 74) lakhs
= Rs. 544.44 lakhs.

Test: Missing Data Interpretation - Question 9

Directions: Study the following table and answer the questions based on it.
Expenditures of a Company (in Lakh Rupees) per Annum Over the given Years.
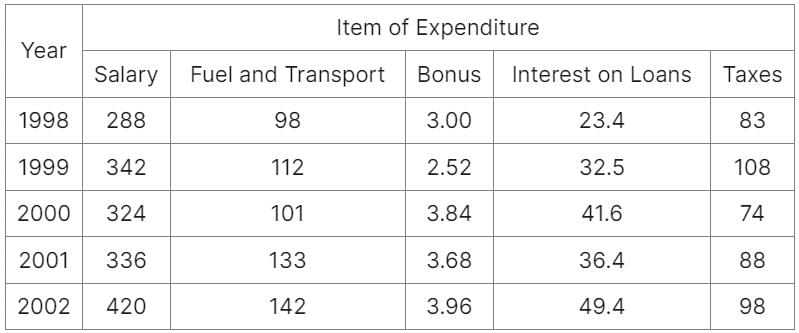
Q. Total expenditure on all these items in 1998 was approximately what percent of the total expenditure in 2002?

Detailed Solution for Test: Missing Data Interpretation - Question 9

Required percentage = 


≈ 69.45%.

Test: Missing Data Interpretation - Question 10

Directions: Study the following table and answer the questions based on it.
Expenditures of a Company (in Lakh Rupees) per Annum Over the given Years.

Q. The ratio between the total expenditure on Taxes for all the years and the total expenditure on Fuel and Transport for all the years respectively is approximately?

Detailed Solution for Test: Missing Data Interpretation - Question 10

Required ratio = 

= [451/586]
= 1/1.3
= 10/13.

17 videos|9 docs|42 tests
Information about Test: Missing Data Interpretation Page
In this test you can find the Exam questions for Test: Missing Data Interpretation solved & explained in the simplest way possible. Besides giving Questions and answers for Test: Missing Data Interpretation, EduRev gives you an ample number of Online tests for practice
Download as PDF