Test: Pie Chart - 2 - CAT MCQ
15 Questions MCQ Test Topic-wise Past Year Questions for CAT - Test: Pie Chart - 2
Directions for Questions: Answer the questions on the basis of the information given below.
Mr. Alfonso has six cars such that each car is of a different brand. The cars with Mr. Alfonso are of the six brands Chevrolet, Ferrari, Honda, Mercedes, BMW and Hyundai. In the months of January and February in the year 2008, Mr. Alfonso drove exactly one car each day. The following table gives details about the days in January and February 2008 on which he did not drive a car of each of the given six brands. Given that January 1, 2008 was a Tuesday.

The number of days in January and February 2008 on which he drove a car of brand Chevrolet, Ferrari, Honda, Mercedes, BMW and Hyundai is denoted by CH, FE, HO, ME, BM and HY respectively.
It is also known that HO > ME > CH > BM > HY > FE.
The following pie – chart gives details about the number of days in January and February 2008 on which he drove a car of brand Honda, BMW and Hyundai.
(2014)
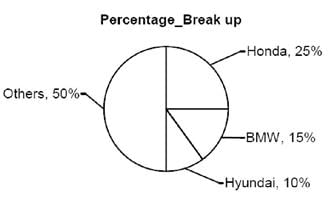
Q. Given that the number of days in January 2008 on which Mr. Alfonso drove the car of brand Honda is the maximum. What is the number of days in February 2008 on which he drove the car of brand Honda?
Mr. Alfonso has six cars such that each car is of a different brand. The cars with Mr. Alfonso are of the six brands Chevrolet, Ferrari, Honda, Mercedes, BMW and Hyundai. In the months of January and February in the year 2008, Mr. Alfonso drove exactly one car each day. The following table gives details about the days in January and February 2008 on which he did not drive a car of each of the given six brands. Given that January 1, 2008 was a Tuesday.

The number of days in January and February 2008 on which he drove a car of brand Chevrolet, Ferrari, Honda, Mercedes, BMW and Hyundai is denoted by CH, FE, HO, ME, BM and HY respectively.
It is also known that HO > ME > CH > BM > HY > FE.
The following pie – chart gives details about the number of days in January and February 2008 on which he drove a car of brand Honda, BMW and Hyundai.

Directions for Questions: Answer the questions on the basis of the information given below.
Mr. Alfonso has six cars such that each car is of a different brand. The cars with Mr. Alfonso are of the six brands Chevrolet, Ferrari, Honda, Mercedes, BMW and Hyundai. In the months of January and February in the year 2008, Mr. Alfonso drove exactly one car each day. The following table gives details about the days in January and February 2008 on which he did not drive a car of each of the given six brands. Given that January 1, 2008 was a Tuesday.

The number of days in January and February 2008 on which he drove a car of brand Chevrolet, Ferrari, Honda, Mercedes, BMW and Hyundai is denoted by CH, FE, HO, ME, BM and HY respectively.
It is also known that HO > ME > CH > BM > HY > FE.
The following pie – chart gives details about the number of days in January and February 2008 on which he drove a car of brand Honda, BMW and Hyundai.
(2014)
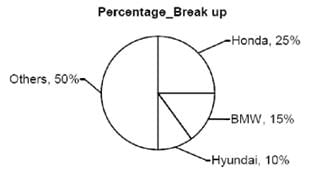
Q. If Mr. Alfonso drove the car of brand Chevrolet on all possible Saturdays in January 2008 and all possible Thursdays in January 2008 and February 2008, then what is the number of days on which he drove Ferrari in the given two months?
Mr. Alfonso has six cars such that each car is of a different brand. The cars with Mr. Alfonso are of the six brands Chevrolet, Ferrari, Honda, Mercedes, BMW and Hyundai. In the months of January and February in the year 2008, Mr. Alfonso drove exactly one car each day. The following table gives details about the days in January and February 2008 on which he did not drive a car of each of the given six brands. Given that January 1, 2008 was a Tuesday.

The number of days in January and February 2008 on which he drove a car of brand Chevrolet, Ferrari, Honda, Mercedes, BMW and Hyundai is denoted by CH, FE, HO, ME, BM and HY respectively.
It is also known that HO > ME > CH > BM > HY > FE.
The following pie – chart gives details about the number of days in January and February 2008 on which he drove a car of brand Honda, BMW and Hyundai.

Q. If Mr. Alfonso drove the car of brand Chevrolet on all possible Saturdays in January 2008 and all possible Thursdays in January 2008 and February 2008, then what is the number of days on which he drove Ferrari in the given two months?
| 1 Crore+ students have signed up on EduRev. Have you? Download the App |
Directions for Questions: Answer the questions on the basis of the information given below.
Mr. Alfonso has six cars such that each car is of a different brand. The cars with Mr. Alfonso are of the six brands Chevrolet, Ferrari, Honda, Mercedes, BMW and Hyundai. In the months of January and February in the year 2008, Mr. Alfonso drove exactly one car each day. The following table gives details about the days in January and February 2008 on which he did not drive a car of each of the given six brands. Given that January 1, 2008 was a Tuesday.

The number of days in January and February 2008 on which he drove a car of brand Chevrolet, Ferrari, Honda, Mercedes, BMW and Hyundai is denoted by CH, FE, HO, ME, BM and HY respectively.
It is also known that HO > ME > CH > BM > HY > FE.
The following pie – chart gives details about the number of days in January and February 2008 on which he drove a car of brand Honda, BMW and Hyundai.
(2014)

Q. What is the difference between the maximum and minimum possible number of days on which Mr. Alfonso drove the car of brand Mercedes in the given two months?
Mr. Alfonso has six cars such that each car is of a different brand. The cars with Mr. Alfonso are of the six brands Chevrolet, Ferrari, Honda, Mercedes, BMW and Hyundai. In the months of January and February in the year 2008, Mr. Alfonso drove exactly one car each day. The following table gives details about the days in January and February 2008 on which he did not drive a car of each of the given six brands. Given that January 1, 2008 was a Tuesday.

The number of days in January and February 2008 on which he drove a car of brand Chevrolet, Ferrari, Honda, Mercedes, BMW and Hyundai is denoted by CH, FE, HO, ME, BM and HY respectively.
It is also known that HO > ME > CH > BM > HY > FE.
The following pie – chart gives details about the number of days in January and February 2008 on which he drove a car of brand Honda, BMW and Hyundai.

Q. What is the difference between the maximum and minimum possible number of days on which Mr. Alfonso drove the car of brand Mercedes in the given two months?
Directions for Questions: Answer the questions on the basis of the information given below.
The subject wise breakup of the marks obtained by 4 students in 5 subjects during their board examination is given below. Assume that all subjects carry equal maximum marks unless specified.
(2014)
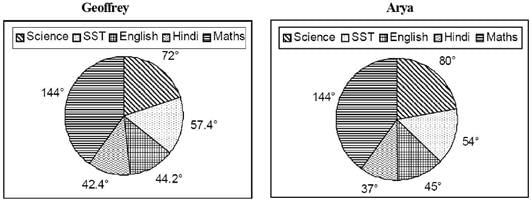
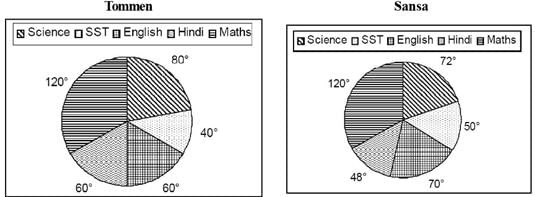
Q. If the minimum percentage required to pass in any subject is 33.33 and it is also known that Arya passed in all the subjects, then what can be the minimum percentage that she can score in English?
Directions for Questions: Answer the questions on the basis of the information given below.
The subject wise breakup of the marks obtained by 4 students in 5 subjects during their board examination is given below. Assume that all subjects carry equal maximum marks unless specified.
(2014)
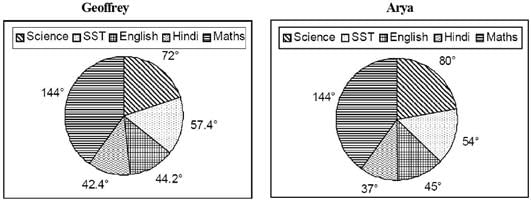
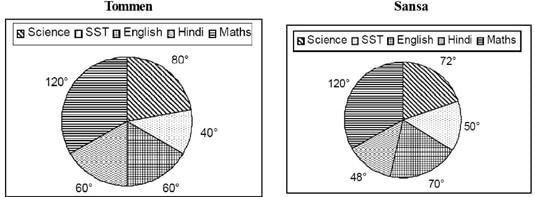
Q. If the pattern of the examination is changed in such a way that the maximum marks for Maths is double of the maximum marks for any other subject (the breakup of marks remaining unchanged), then what is the ratio of maximum marks, in all the subjects put together, which Geoffrey can score to the maximum marks, in all the subjects put together, which Tommen can score?
Directions for Questions: Answer the questions on the basis of the information given below.
The subject wise breakup of the marks obtained by 4 students in 5 subjects during their board examination is given below. Assume that all subjects carry equal maximum marks unless specified.
(2014)
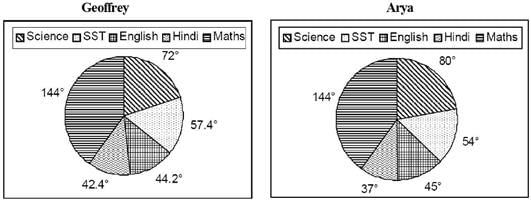
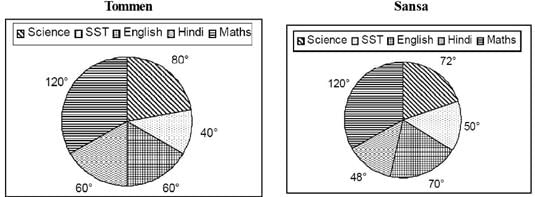
Q. If the pattern of the examination is changed in such a way that the maximum marks for Maths is double of the maximum marks for any other subject (the breakup of marks remaining unchanged), then what is the ratio of maximum marks, in all the subjects put together, which Sansa can score after the change in pattern and before the change in pattern?
Directions for Questions: Answer the questions on the basis of the information given below.
The subject wise breakup of the marks obtained by 4 students in 5 subjects during their board examination is given below. Assume that all subjects carry equal maximum marks unless specified.
(2014)
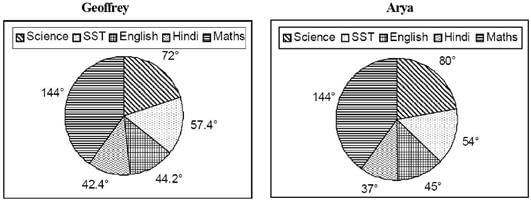
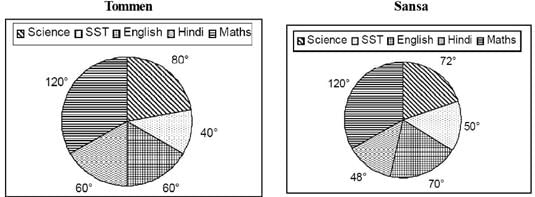
Q. If the marks scored by Geoffrey in Maths is maximum possible then what is the average of percentage marks scored by him in all the subjects?
Directions for Questions: Answer the questions on the basis of the information given below.
The pie charts given below show the distribution of the number of athletes sent by three countries to take part in eight different games in the recently held Olympics. The numbers of athletes sent by USA, China and Russia were in the ratio 8 : 11 : 5. It is also known that the total number of athletes sent by the three countries put together was 2400.
(2013)

Q. The female to male ratio for Cycling athletes from Russia and USA was 1 : 19 and 4 : 1 respectively. If the number of female Cycling athletes was equal to the number of male Cycling athletes for the three countries put together, then what was the number of female Cycling athletes from China?
Directions for Questions: Answer the questions on the basis of the information given below.
The pie charts given below show the distribution of the number of athletes sent by three countries to take part in eight different games in the recently held Olympics. The numbers of athletes sent by USA, China and Russia were in the ratio 8 : 11 : 5. It is also known that the total number of athletes sent by the three countries put together was 2400.
(2013)

Q. What was the absolute difference between the maximum number of athletes sent by China for a game and the minimum number of athletes sent by Russia for a game?
Directions for Questions: Answer the questions on the basis of the information given below.
The pie charts given below show the distribution of the number of athletes sent by three countries to take part in eight different games in the recently held Olympics. The numbers of athletes sent by USA, China and Russia were in the ratio 8 : 11 : 5. It is also known that the total number of athletes sent by the three countries put together was 2400.
(2013)

Q. The number of Water Polo athletes constituted what percent of the total number of athletes sent by the three countries put together?
Directions for Questions: Answer the following questions on the basis of the information given below.
The following table gives the sales turnover (in crore ₹) of the five major detergent brands A, B, C, D, E and others in the 4 regions East, West, North and South of India. The data is for the years 2008 and 2009. The pie chart gives the breakup of the sales of the same brands in terms of the number of units sold. The total number of units sold for 2008 and 2009 was the same.
(2012)

Volume-wise Breakup of Brands All India
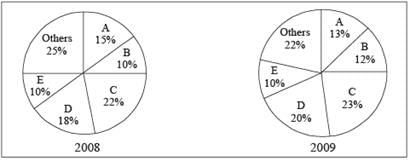
Q. What is the total sales turnover (in crore ₹) of the detergent market in India in the year 2009?
Directions for Questions: Answer the following questions on the basis of the information given below.
The following table gives the sales turnover (in crore ₹) of the five major detergent brands A, B, C, D, E and others in the 4 regions East, West, North and South of India. The data is for the years 2008 and 2009. The pie chart gives the breakup of the sales of the same brands in terms of the number of units sold. The total number of units sold for 2008 and 2009 was the same.
(2012)

Volume-wise Breakup of Brands All India

Q. Which brand registered the maximum percentage increase in the price per unit in 2009?
Directions for Questions: Answer the following questions on the basis of the information given below.
The following table gives the sales turnover (in crore ₹) of the five major detergent brands A, B, C, D, E and others in the 4 regions East, West, North and South of India. The data is for the years 2008 and 2009. The pie chart gives the breakup of the sales of the same brands in terms of the number of units sold. The total number of units sold for 2008 and 2009 was the same.
(2012)

Volume-wise Breakup of Brands All India

Q. Which of the following statement(s) is/are true?
1. Exactly two brands could not register a growth in all the regions in 2009.
2. The number of units sold by B in 2009 has shown an increase of above 350% in South.
3. The number of units sold by C in 2009 was less than that sold by C in 2008.
Directions for Questions: Answer the questions on the basis of the information given below.
The break-up of the financial budget of a country called Chaupatland for FY 2010-11 is represented by the pie charts given below. Pie chart A represents Budgeted Revenue and pie chart B represents Budgeted Expenditure.
(2010)
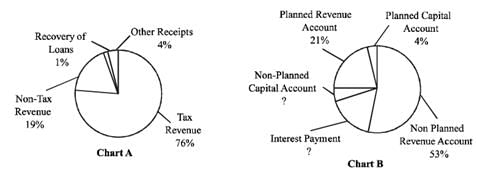
Q. The difference between Budgeted Expenditure and Budgeted Revenue was what percentage of Budgeted Revenue?
Directions for Questions: Answer the questions on the basis of the information given below.
The break-up of the financial budget of a country called Chaupatland for FY 2010-11 is represented by the pie charts given below. Pie chart A represents Budgeted Revenue and pie chart B represents Budgeted Expenditure.
(2010)
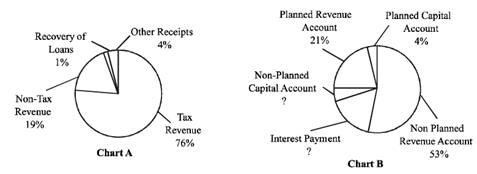
Q. By how much did the sum of Planned Revenue Account and Planned Capital Account exceed Non-Tax Revenue?
|
43 docs|31 tests
|
|
43 docs|31 tests
|


 ⇒ 734 / 725 × 15 / 13 = 1.168%


