Test: Quality Analysis & Control - 2 - Mechanical Engineering MCQ
10 Questions MCQ Test Topicwise Question Bank for Mechanical Engineering - Test: Quality Analysis & Control - 2
Consider the following statements pertaining to control charts:
1. Values above the upper and lower control limits indicate points out of adjustment.
2. Control charts are built so that new data can be quickly compared to past performance data.
3. Control charts graphically present data.
4. Control charts plot data over time.
Which of the above are correct?
1. Values above the upper and lower control limits indicate points out of adjustment.
2. Control charts are built so that new data can be quickly compared to past performance data.
3. Control charts graphically present data.
4. Control charts plot data over time.
Which of the above are correct?
| 1 Crore+ students have signed up on EduRev. Have you? Download the App |
Statistical quality control considers the pattern of variation in the quality characteristics of a product due to
Acceptance sampling is used where
1. Inspection cost in high.
2. 100% inspection causes fatigue.
3. Inspection involves distributive testing.
Which of the above are valid?
Which one of the following is not the characteristic of acceptance sampling?
4 Which is the control chart for per cent defectives or for fraction defectives?
Identify the chart in which number of defects in a piece or in a sample are plotted
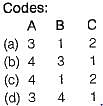
Match List-I (Scientist) with List-II (Research work) and select the correct answer using the codes given below the lists:


In a weaving operation, the parameter to be controlled is the number of defects per 10 square yards of material. Control chart appropriate for this task is
|
45 videos|314 tests
|
|
45 videos|314 tests
|


