SSC CGL Exam  >  SSC CGL Tests  >  SSC CGL Previous Year Papers  >   Test: SSC CGL Previous Year Questions: Venn Diagram (2020-19) - SSC CGL MCQ

Test: SSC CGL Previous Year Questions: Venn Diagram (2020-19) - SSC CGL MCQ


Test Description

30 Questions MCQ Test SSC CGL Previous Year Papers - Test: SSC CGL Previous Year Questions: Venn Diagram (2020-19)

Test: SSC CGL Previous Year Questions: Venn Diagram (2020-19) for SSC CGL 2024 is part of SSC CGL Previous Year Papers preparation. The Test: SSC CGL Previous Year Questions: Venn Diagram (2020-19) questions and answers have been prepared according to the SSC CGL exam syllabus.The Test: SSC CGL Previous Year Questions: Venn Diagram (2020-19) MCQs are made for SSC CGL 2024 Exam. Find important definitions, questions, notes, meanings, examples, exercises, MCQs and online tests for Test: SSC CGL Previous Year Questions: Venn Diagram (2020-19) below.
Solutions of Test: SSC CGL Previous Year Questions: Venn Diagram (2020-19) questions in English are available as part of our SSC CGL Previous Year Papers for SSC CGL & Test: SSC CGL Previous Year Questions: Venn Diagram (2020-19) solutions in Hindi for SSC CGL Previous Year Papers course. Download more important topics, notes, lectures and mock test series for SSC CGL Exam by signing up for free. Attempt Test: SSC CGL Previous Year Questions: Venn Diagram (2020-19) | 39 questions in 20 minutes | Mock test for SSC CGL preparation | Free important questions MCQ to study SSC CGL Previous Year Papers for SSC CGL Exam | Download free PDF with solutions
Test: SSC CGL Previous Year Questions: Venn Diagram (2020-19) - Question 1

Select the venn diagram that best illustrates the relationship between the following classes.  [CGL 04/06/2019 Morning]
Uncle, Relatives, Rich.

Detailed Solution for Test: SSC CGL Previous Year Questions: Venn Diagram (2020-19) - Question 1

All uncles come under the category of relatives. But all uncles and relatives may not be rich. So the condition of some will be true.

Test: SSC CGL Previous Year Questions: Venn Diagram (2020-19) - Question 2

Select the Venn diagram that best illustrates the relationship between the following classes.  [CGL 04/06/2019 afternoon]
Parents, Rich Persons, Farmers.

Detailed Solution for Test: SSC CGL Previous Year Questions: Venn Diagram (2020-19) - Question 2

All parents arc neither rich nor farmers , but some sharing between all three is possible.

1 Crore+ students have signed up on EduRev. Have you? Download the App
Test: SSC CGL Previous Year Questions: Venn Diagram (2020-19) - Question 3

Select the Venn Diagram that best illustrates the relationship between the following classes. [CGL 04/06/2019 Evening]
Graduates , Literates and Hardworking.

Detailed Solution for Test: SSC CGL Previous Year Questions: Venn Diagram (2020-19) - Question 3

Graduates , Literates and Hardworking. Here, Graduates come under the class Litrates. But all it is not necessary that all Graduates or Literates are Hardworking. But the condition of some can be true.

Test: SSC CGL Previous Year Questions: Venn Diagram (2020-19) - Question 4

Select the Venn diagram that illustrates the relationship between the following classes.[CGL 06/06/2019 Morning]
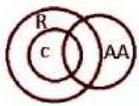
Snakes, Reptiles, Poisonous.

Detailed Solution for Test: SSC CGL Previous Year Questions: Venn Diagram (2020-19) - Question 4

Snakes, Reptiles, Poisonous ; Reptiles is a class and Snakes is a name of a member of it. But neither all reptiles nor all snakes are poisonous. But they surely have relationships of some.

Test: SSC CGL Previous Year Questions: Venn Diagram (2020-19) - Question 5

Select the Venn diagram that best illustrates the relationship between the following classes. [CGL 06/06/19 Afternoon]
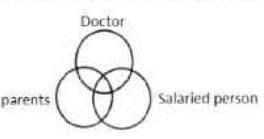
Doctors/ Salaried Persons/ Parents.

Detailed Solution for Test: SSC CGL Previous Year Questions: Venn Diagram (2020-19) - Question 5

Doctors, Salaried Persons, Parents ; All doctors are neither salaried persons nor parents. Similarly, all
parents arc not salaried persons. But these three have the condition of Some.

Test: SSC CGL Previous Year Questions: Venn Diagram (2020-19) - Question 6

Choose the Venn diagram that best illustrates the relationship among the following classes. [CGL 06/06/2019 Evening]
Women , Entrepreneurs , Engineers.

Detailed Solution for Test: SSC CGL Previous Year Questions: Venn Diagram (2020-19) - Question 6

All Women are neither Entrepreneurs nor Engineers. Similarly, all Entrepreneurs are not Engineers. But these three have some condition of Some with each other.

Test: SSC CGL Previous Year Questions: Venn Diagram (2020-19) - Question 7

Choose the venn diagram that best illustrates the relationship among the following classes. [CGL 07/06/2019 Morning]
Crocodiles, Aquatic animals , Reptiles

Detailed Solution for Test: SSC CGL Previous Year Questions: Venn Diagram (2020-19) - Question 7

Crocodile belongs to the reptile class and it may or may not live in water.

Test: SSC CGL Previous Year Questions: Venn Diagram (2020-19) - Question 8

elect the venn diagram that best illustrates the relationship between the following classes. [CGL 07/06/2019 Evening]
Villagers , Poor Persons , Males.

Detailed Solution for Test: SSC CGL Previous Year Questions: Venn Diagram (2020-19) - Question 8

Test: SSC CGL Previous Year Questions: Venn Diagram (2020-19) - Question 9

Select the venn diagram that best illustrates the relationship between the following classes. [CGL10/06/2019 Morning]
Indians , Females , Voters.

Detailed Solution for Test: SSC CGL Previous Year Questions: Venn Diagram (2020-19) - Question 9

when there is a relation of some between all three this venn diagram is the answer.

Test: SSC CGL Previous Year Questions: Venn Diagram (2020-19) - Question 10

Which one of the following figures represents students, teachers and schools? [CGL 10/06/2019 Afternoon]

Detailed Solution for Test: SSC CGL Previous Year Questions: Venn Diagram (2020-19) - Question 10

Test: SSC CGL Previous Year Questions: Venn Diagram (2020-19) - Question 11

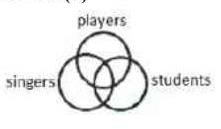
Which one of the following figures represents players, singers and students? [CGL 10/06/2019 Evening]

Detailed Solution for Test: SSC CGL Previous Year Questions: Venn Diagram (2020-19) - Question 11

Test: SSC CGL Previous Year Questions: Venn Diagram (2020-19) - Question 12

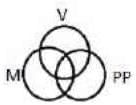
 Which one of the following figures represents wheat, mustard and cabbage? [CGL 11/06/2019 Morning]

Detailed Solution for Test: SSC CGL Previous Year Questions: Venn Diagram (2020-19) - Question 12

Test: SSC CGL Previous Year Questions: Venn Diagram (2020-19) - Question 13

In the given venn diagram, the rectangle represents ‘Women’ , the pentagon represents ‘Entrepreneurs’ and the triangle represents ‘Mothers’. The number given in the diagram represents the number of persons in that particular category.  [CGL 12/06/2019 Evening]
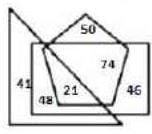
How many women are entrepreneurs but NOT mothers? 

Detailed Solution for Test: SSC CGL Previous Year Questions: Venn Diagram (2020-19) - Question 13

74.

Test: SSC CGL Previous Year Questions: Venn Diagram (2020-19) - Question 14

The given Venn diagram represents employees in an organisation The triangle represents executives, the circle represents females, the rectangle represents MBAs and the square represents technical staff. The numbers given in the diagram represent the number of persons in that particular category. [CGL 3/3/2020 Morning]
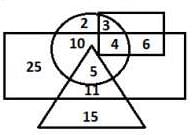

How many female executives are there in the organisation?

Detailed Solution for Test: SSC CGL Previous Year Questions: Venn Diagram (2020-19) - Question 14

We can clearly sec from the figure that ‘5' Female executives are there in the organization because 5 is common in both the circle and the triangle which are representing executives and females.

Test: SSC CGL Previous Year Questions: Venn Diagram (2020-19) - Question 15

The given Venn diagram represents employees in an organisation The triangle represents ‘teachers’, the circle represents ‘ladies’, the rectangle represents ‘unmarried persons’. The numbers given in the diagram represent the number of persons in that particular category. [CGL 3/3/2020 Afternoon]
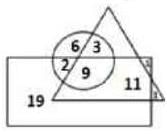
How many married ladies are teachers.

Detailed Solution for Test: SSC CGL Previous Year Questions: Venn Diagram (2020-19) - Question 15

As we can observe, 3 & 9 are common in the triangle and the circle representing teachers & ladies. Now, we want married ladies for which we have to take a number which should not be in the rcctangle(reprcsenting unmarried peoples) but common to both triangle and circle. Hence, 3 is the answer.

Test: SSC CGL Previous Year Questions: Venn Diagram (2020-19) - Question 16

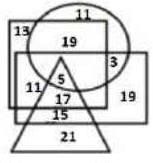
Thc given Venn diagram represents artists in a circus: The triangle represents Clowns, the circle represents acrobats, the rectanglerepresents males and the square represents ringmasters. The numbers given in the diagram represent the number of persons in that particular category. [CGL 4/3/2020 Morning]
How many male clowns are also ringmasters, but NOT acrobats.

Detailed Solution for Test: SSC CGL Previous Year Questions: Venn Diagram (2020-19) - Question 16

The rectangle represents males and the triangle represents Clowns. So, 5, 7 & 15 represents male clowns. Now, the square represents ringmasters. So, 5 & 17 represents male clowns who are also ringmasters. But, we have to exclude acrobats. So, 17 is the correct answer.

Test: SSC CGL Previous Year Questions: Venn Diagram (2020-19) - Question 17

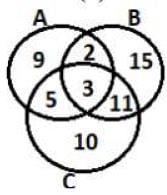
In the given Venn diagram ‘Group A’ represents those who can speak ‘English’, ‘Group B’ represents those who can speak ‘Hindi’, and ‘Group C’ represents those who can speak ‘Marathi’. The numbers given in the diagram represent the number of persons in that particular category. [CGL 4/3/2020 Afternoon]
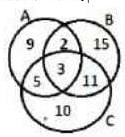
How many persons can speak exactly two languages?

Detailed Solution for Test: SSC CGL Previous Year Questions: Venn Diagram (2020-19) - Question 17


5 + 11 + 2 = 18

Test: SSC CGL Previous Year Questions: Venn Diagram (2020-19) - Question 18

In the given Venn diagram, the ‘rectangle’ represents ‘engineers’, the ‘circle’ represents ‘managers’, and the ‘triangle’ represents ‘married’. The numbers given the diagram represent the number of persons in that particular category. [CGL 4/3/2020 Evening]
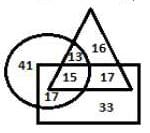
How many people arc married but NOT engineers?

Detailed Solution for Test: SSC CGL Previous Year Questions: Venn Diagram (2020-19) - Question 18

The triangle represents married people and the rectangle represents engineers but wc want married people and not engineers.
Hence, 13 + 16 = 29( Married but not Engineers) is the answer.

Test: SSC CGL Previous Year Questions: Venn Diagram (2020-19) - Question 19

In the given Venn diagram, the triangle represents students playing table tennis , the rectangle represents students playing badminton, the circle represents female students, and the pentagon represents students playing football. The numbers given in the diagram represent the number of person in the particular category. [CGL 5/3/2020 Morning]
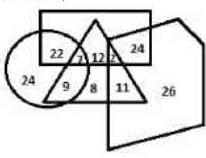
How many female students play both table tennis and badminton?

Detailed Solution for Test: SSC CGL Previous Year Questions: Venn Diagram (2020-19) - Question 19

The circle represents female students, the  triangle respresents students playing table tennis and the rectangle represents students playing badminton. So, the number common to all is 7 because it lies in Circe, triangle and rectangle.

Test: SSC CGL Previous Year Questions: Venn Diagram (2020-19) - Question 20

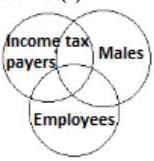
Which o f th e fo llo w in g Venn diagrams best represents the relationship between the following classes? [CGL 5/3/2020 Afternoon]
Income Tax payers/ Employees/  Males.

Detailed Solution for Test: SSC CGL Previous Year Questions: Venn Diagram (2020-19) - Question 20

Test: SSC CGL Previous Year Questions: Venn Diagram (2020-19) - Question 21

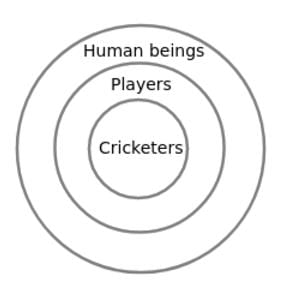
Which of  thefollowing Venn diagrams best represents the relationship between the following classes? [CGL 5/3/2020 Evening]
Cricketers/Players/ Human beings.

Detailed Solution for Test: SSC CGL Previous Year Questions: Venn Diagram (2020-19) - Question 21

The following vein diagram shows the relationship between cricketer, human beings & Players.

Test: SSC CGL Previous Year Questions: Venn Diagram (2020-19) - Question 22

In the given Venn diagram, the ‘rectangle’ represents ‘travellers who like to travel by plane’, the ‘circle’ represents ‘travellers who like to travel by bus’ , and the ‘triangle ‘represents travellers who like to travellers who like to travel by train’. The numbers given in the diagram represent the number of travellers in that particular category. [CGL 6/3/2020 Morning]
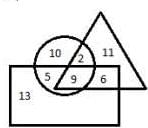
How many travellers like to travel cither by train or plane but NOT by bus? 

Detailed Solution for Test: SSC CGL Previous Year Questions: Venn Diagram (2020-19) - Question 22

Only plane = 11
Only train = 13
Both bus and plane = 6
13 + 6 + 11 = 3 0

Test: SSC CGL Previous Year Questions: Venn Diagram (2020-19) - Question 23

Which of the following sets is best represented by the given Venn diagram ? [CGL 6/3/2020 Afternoon]
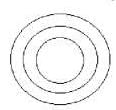
Detailed Solution for Test: SSC CGL Previous Year Questions: Venn Diagram (2020-19) - Question 23

Test: SSC CGL Previous Year Questions: Venn Diagram (2020-19) - Question 24

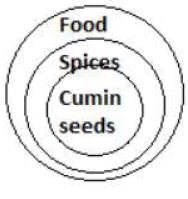
W hich o f th e fo llo w in g Venn diagrams best represents the relationship between the following classes? [CGL 6/3/2020 Evening]
Spices , Cumin seeds, Food

Detailed Solution for Test: SSC CGL Previous Year Questions: Venn Diagram (2020-19) - Question 24

Test: SSC CGL Previous Year Questions: Venn Diagram (2020-19) - Question 25

Thc given Venn diagram  represents results of a class of students.[CGL 7/3/2020 Morning]
The triangle represents students who scored 85% and above in Maths, the circle represents students who scored 85% and above in English, the rectangle represents students who scored 85% and above in Science, and the square represents students who scored 85% and above in Social Sciences. The numbers given in the diagram represent the number of students in that particular category.
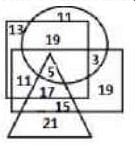
How many students scored 85% and above in all the subjects?

Detailed Solution for Test: SSC CGL Previous Year Questions: Venn Diagram (2020-19) - Question 25

‘5’ depicts students who scored 85% and above in all the subjects because it is common to all the figures which are containing different subjects.

Test: SSC CGL Previous Year Questions: Venn Diagram (2020-19) - Question 26

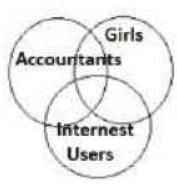
W hich o f the fo llo w in g Venn diagrams best represents the relationship between the following classes? [CGL 7/3/2020 Afternoon]
Accountants, Girls, Internet users

Detailed Solution for Test: SSC CGL Previous Year Questions: Venn Diagram (2020-19) - Question 26

Test: SSC CGL Previous Year Questions: Venn Diagram (2020-19) - Question 27

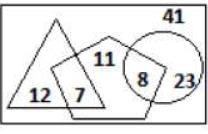
In the given Venn Diagram, the ‘rectangle’ represents ‘ladies of a club' , the ‘triangle’ represents ‘like to dance’, the ‘circle’ represents ‘like to sing’ and the ‘pentagon’ represents ‘like to mimic’. The number given in the diagram represents the number of persons in that particular category. [ CGL 7/3/2020 Evening]
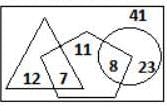
How many ladies of the club NEITHER like to dance NOR like to mimic?

Detailed Solution for Test: SSC CGL Previous Year Questions: Venn Diagram (2020-19) - Question 27

Number of ladies of the club who NEITHER like to dance NOR like to mimic = 41 + 23 = 64 Hence, ‘64' is the correct answer.

Test: SSC CGL Previous Year Questions: Venn Diagram (2020-19) - Question 28

IWhich o f the following Venn diagrams best represents the relationship between the classes? [CGL 9/3/2020 Morning]
Tables , Wooden objects ,Chairs.

Detailed Solution for Test: SSC CGL Previous Year Questions: Venn Diagram (2020-19) - Question 28

Test: SSC CGL Previous Year Questions: Venn Diagram (2020-19) - Question 29

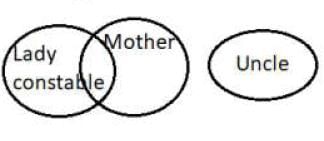
Which o f the following Venn diagrams best represents the relationship between the following classes? [CGL 9/3/2020 Afternoon]
Lady Constables , Uncles , Mothers 

Detailed Solution for Test: SSC CGL Previous Year Questions: Venn Diagram (2020-19) - Question 29

Test: SSC CGL Previous Year Questions: Venn Diagram (2020-19) - Question 30

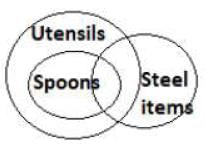
Which of the following Venn diagrams best represents the relationship between the following classes? [CGL 9/3/2020 Evening]
Utensils , Spoons , Steel items.

Detailed Solution for Test: SSC CGL Previous Year Questions: Venn Diagram (2020-19) - Question 30

View more questions
316 docs|268 tests
Information about Test: SSC CGL Previous Year Questions: Venn Diagram (2020-19) Page
In this test you can find the Exam questions for Test: SSC CGL Previous Year Questions: Venn Diagram (2020-19) solved & explained in the simplest way possible. Besides giving Questions and answers for Test: SSC CGL Previous Year Questions: Venn Diagram (2020-19), EduRev gives you an ample number of Online tests for practice

Top Courses for SSC CGL

Download as PDF

Top Courses for SSC CGL