Test: Scatter Plot Graph - 2 - GMAT MCQ
6 Questions MCQ Test - Test: Scatter Plot Graph - 2
Directions: Refer to the following graph.
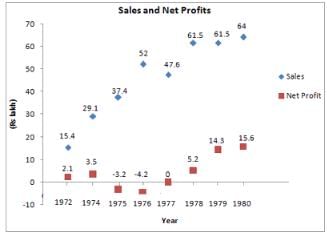
Q. If a tax of 55 % is to be paid on gross profit before the net profit of that particular year is arrived at, what is the combined gross profit for the years ‘79 and ‘80? (' in Lakhs)

Directions: Refer to the following graph.
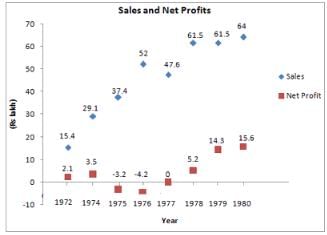
Q. In which of the following years was the expenditure of the company the maximum?

Directions: Refer to the following graph.
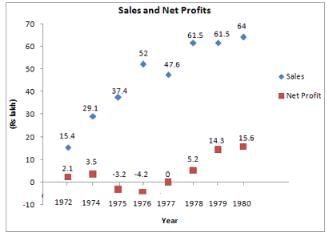
Q. If the expenses on advertising the products in 1980 was 2.5 % of the total sales turnover of the company, what was it as a percentage of the net profit in 1980?

Directions: Refer to the following graph and answer the questions given below:
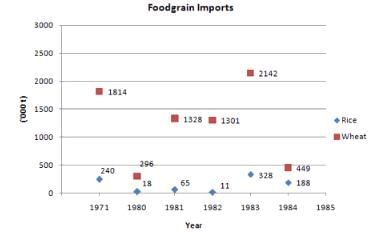
The total values of food grains (rice and wheat) imported during these years are given below:
1971 : Rs. 123 crore
1980 : Rs. 80 crore
1981 : Rs. 314 crore
1982 : Rs. 295 crore
1983 : Rs. 587 crore
1984 : Rs. 158 crore
Q. If the import price of wheat was Rs. 2,400 per tonne in 1983, then what was the import price of rice per tonne during that year?
Directions: Refer to the following graph and answer the questions given below:
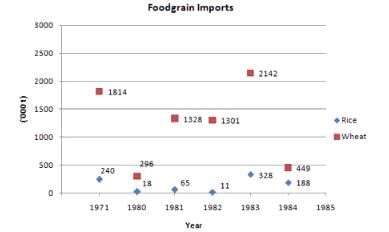
The total values of food grains (rice and wheat) imported during these years are given below:
1971 : Rs. 123 crore
1980 : Rs. 80 crore
1981 : Rs. 314 crore
1982 : Rs. 295 crore
1983 : Rs. 587 crore
1984 : Rs. 158 crore
Q. Wheat formed what percent of the volume of total imports of food grains from 1980-84?
Directions: Refer to the following graph and answer the questions given below:
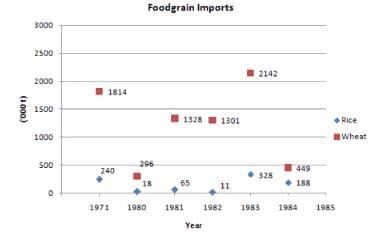
The total values of food grains (rice and wheat) imported during these years are given below:
1971 : Rs. 123 crore
1980 : Rs. 80 crore
1981 : Rs. 314 crore
1982 : Rs. 295 crore
1983 : Rs. 587 crore
1984 : Rs. 158 crore
Q. In which year was the ratio of rice to wheat imports the highest?


