Class 7 Exam  >  Class 7 Tests  >  Mathematics (Maths) Class 7  >  Olympiad Test: Data Handling - Class 7 MCQ

Olympiad Test: Data Handling - Class 7 MCQ


Test Description

20 Questions MCQ Test Mathematics (Maths) Class 7 - Olympiad Test: Data Handling

Olympiad Test: Data Handling for Class 7 2024 is part of Mathematics (Maths) Class 7 preparation. The Olympiad Test: Data Handling questions and answers have been prepared according to the Class 7 exam syllabus.The Olympiad Test: Data Handling MCQs are made for Class 7 2024 Exam. Find important definitions, questions, notes, meanings, examples, exercises, MCQs and online tests for Olympiad Test: Data Handling below.
Solutions of Olympiad Test: Data Handling questions in English are available as part of our Mathematics (Maths) Class 7 for Class 7 & Olympiad Test: Data Handling solutions in Hindi for Mathematics (Maths) Class 7 course. Download more important topics, notes, lectures and mock test series for Class 7 Exam by signing up for free. Attempt Olympiad Test: Data Handling | 20 questions in 20 minutes | Mock test for Class 7 preparation | Free important questions MCQ to study Mathematics (Maths) Class 7 for Class 7 Exam | Download free PDF with solutions
Olympiad Test: Data Handling - Question 1

The table shows the number of hours Pavan studies on different days of a week.

How many hours per day does he study on an average?

Detailed Solution for Olympiad Test: Data Handling - Question 1

 Average =hours

Olympiad Test: Data Handling - Question 2

Find the range of the data.
128,139,148,132,152,154,140,143,146,149,142

Detailed Solution for Olympiad Test: Data Handling - Question 2

The range of a given data is the difference between its highest and lowest values. From the given data, range =154−128=26.

1 Crore+ students have signed up on EduRev. Have you? Download the App
Olympiad Test: Data Handling - Question 3

Direction: The bar graph shows the sales of fruits and vegetables in a store in 4 hours on a certain evening.
Sales of fruits and vegetables in a store
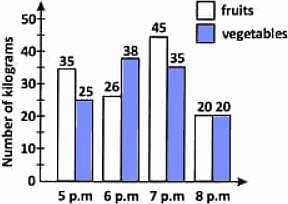
When was the sale of fruits lesser than that of vegetables?

Detailed Solution for Olympiad Test: Data Handling - Question 3

seen in the diagram at 6 pm fruits sale < vegetables sale

Olympiad Test: Data Handling - Question 4

Direction: The bar graph shows the sales of fruits and vegetables in a store in 4 hours on a certain evening.
Sales of fruits and vegetables in a store
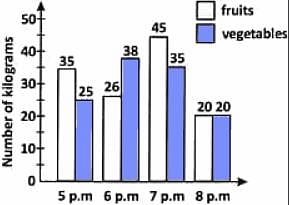
How many kilograms of fruits were sold during the four hours?

Detailed Solution for Olympiad Test: Data Handling - Question 4

No. of kilograms of-fruits sold during the four hours= 35+26+45+20=126.

Olympiad Test: Data Handling - Question 5

Which of the following is true?

Detailed Solution for Olympiad Test: Data Handling - Question 5

Mean of first 5 natural numbers = 
Median of 1,2,◯3,4,5,=3

Olympiad Test: Data Handling - Question 6

Direction: The bar graph shows the sales of fruits and vegetables in a store in 4 hours on a certain evening.
Sales of fruits and vegetables in a store
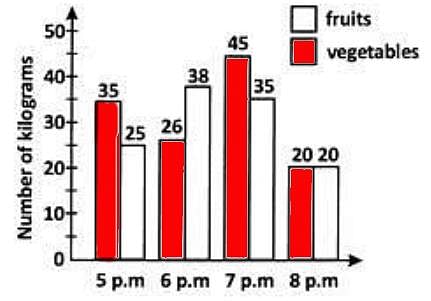
 During the four hours, which of the following is true about the sale of fruits and vegetables?

Detailed Solution for Olympiad Test: Data Handling - Question 6
  •   No. of kilograms of-fruits sold during the four hours

    =35+26+45+20=126

    .
Olympiad Test: Data Handling - Question 7

Direction: The bargraph shows the marks obtained by four students in quarterly examination. 
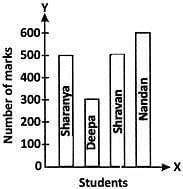
Whose performance was the best?

Olympiad Test: Data Handling - Question 8

What is the arithmetic mean of first five prime numbers?

Detailed Solution for Olympiad Test: Data Handling - Question 8

The first five prime numbers are 2, 3, 5, 7 and 11.
∴Their mean == 5.6

Olympiad Test: Data Handling - Question 9

 Direction: The bargraph shows the marks obtained by four students in quarterly examination.
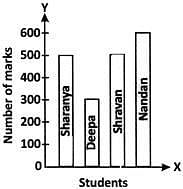
Whose performance was the worst? 

Detailed Solution for Olympiad Test: Data Handling - Question 9

Since two dice are thrown simultaneously total numbers of outcomes are 6*6=36 . We make pairs of it
(1,1)   (2,1)   (3,1).....(6,1)
   :         :         :    :::::     :
(1,6)   (2,6)   (3,6).....(6,6)

Olympiad Test: Data Handling - Question 10

Direction: The bargraph shows the marks obtained by four students in quarterly examination.
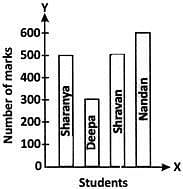
Which two students secured equal marks?

Olympiad Test: Data Handling - Question 11

There are 2 red, 3 blue and 5 black balls in a bag. A ball is drawn from the bag without looking in to the bag. What is the probability of getting a red ball?

Detailed Solution for Olympiad Test: Data Handling - Question 11

Total number of outcomes = 10
No. of favourable outcomes = 2 red balls
Probability of red balls =  No. of favourable outcomes/Total number of outcomes
= 2/10= 1/5 

Olympiad Test: Data Handling - Question 12

There are 2 red, 3 blue and 5 black balls in a bag. A ball is drawn from the bag without looking in to the bag. What is the probability of getting a blue ball?

Olympiad Test: Data Handling - Question 13

There are 2 red, 3 blue and 5 black balls in a bag. A ball is drawn from the bag without looking in to the bag. What is the probability of getting a black ball?

Detailed Solution for Olympiad Test: Data Handling - Question 13

Number of red balls = 2

Total number of balls = 2 + 3 + 5

Performing addition

Total number of balls = 10

Keep the values in formula to find the probability of getting black ball.

Performing division

Probability of getting black ball = 5/10

Hence, the probability of getting a black ball is 1/2

Olympiad Test: Data Handling - Question 14

There are 2 red, 3 blue and 5 black balls in a bag. A ball is drawn from the bag without looking in to the bag. What is the probability of getting a non-blue ball?

Olympiad Test: Data Handling - Question 15

There are 2 red, 3 blue and 5 black balls in a bag. A ball is drawn from the bag without looking in to the bag. What is the probability of getting a non-black ball?

Detailed Solution for Olympiad Test: Data Handling - Question 15

The number of black balls =5 

Probability of getting black ball = 5/10 = 1/2

Probability of getting a non black ball = 1 - Probability of getting a black ball

= 1 -1/2 = 1/2

Olympiad Test: Data Handling - Question 16

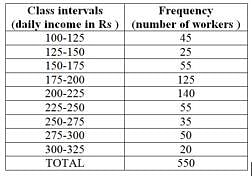
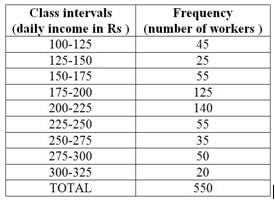
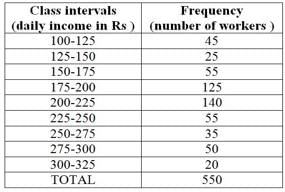
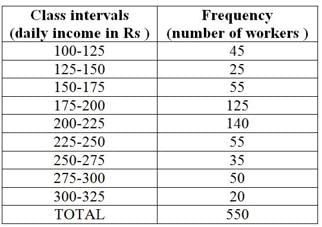
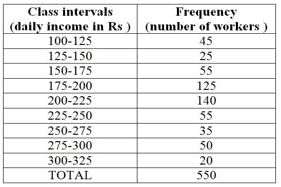
What is the size of class intervals?

Detailed Solution for Olympiad Test: Data Handling - Question 16

Understanding Class Intervals

In a frequency distribution table, class intervals represent the ranges of data grouped together. The size of a class interval is the difference between the upper limit and the lower limit of any class.

Analyzing the Table

From the table, we can observe the following class intervals:

  • 100-125
  • 125-150
  • 150-175
  • 175-200
  • 200-225
  • 225-250
  • 250-275
  • 275-300
  • 300-325

Calculating the Size

Let's take the first class interval as an example: 100-125.

  • Upper limit = 125
  • Lower limit = 100

Size of the class interval = Upper limit - Lower limit = 125 - 100 = 25

Consistent Size

If we calculate the size of other class intervals in the same way, we will find that they all have the same size of 25.

Conclusion

Therefore, the size of the class intervals in the given table is 25.

Olympiad Test: Data Handling - Question 17

Which class has the highest frequency?

Olympiad Test: Data Handling - Question 18

Which class has the lowest frequency?

Olympiad Test: Data Handling - Question 19

What is the upper limit of the class interval 250-275?
Detailed Solution for Olympiad Test: Data Handling - Question 19

Upper limit is the largest quantity in the interval. So the upper limit is 275.

Olympiad Test: Data Handling - Question 20

What is the frequency of class interval 300-325?

76 videos|345 docs|39 tests
Information about Olympiad Test: Data Handling Page
In this test you can find the Exam questions for Olympiad Test: Data Handling solved & explained in the simplest way possible. Besides giving Questions and answers for Olympiad Test: Data Handling, EduRev gives you an ample number of Online tests for practice

Top Courses for Class 7

76 videos|345 docs|39 tests
Download as PDF

Top Courses for Class 7