CA Foundation Exam  >  CA Foundation Tests  >  Quantitative Aptitude for CA Foundation  >  Test: Measures Of Central Tendency And Dispersion- 1 - CA Foundation MCQ

Test: Measures Of Central Tendency And Dispersion- 1 - CA Foundation MCQ


Test Description

30 Questions MCQ Test Quantitative Aptitude for CA Foundation - Test: Measures Of Central Tendency And Dispersion- 1

Test: Measures Of Central Tendency And Dispersion- 1 for CA Foundation 2024 is part of Quantitative Aptitude for CA Foundation preparation. The Test: Measures Of Central Tendency And Dispersion- 1 questions and answers have been prepared according to the CA Foundation exam syllabus.The Test: Measures Of Central Tendency And Dispersion- 1 MCQs are made for CA Foundation 2024 Exam. Find important definitions, questions, notes, meanings, examples, exercises, MCQs and online tests for Test: Measures Of Central Tendency And Dispersion- 1 below.
Solutions of Test: Measures Of Central Tendency And Dispersion- 1 questions in English are available as part of our Quantitative Aptitude for CA Foundation for CA Foundation & Test: Measures Of Central Tendency And Dispersion- 1 solutions in Hindi for Quantitative Aptitude for CA Foundation course. Download more important topics, notes, lectures and mock test series for CA Foundation Exam by signing up for free. Attempt Test: Measures Of Central Tendency And Dispersion- 1 | 40 questions in 40 minutes | Mock test for CA Foundation preparation | Free important questions MCQ to study Quantitative Aptitude for CA Foundation for CA Foundation Exam | Download free PDF with solutions
Test: Measures Of Central Tendency And Dispersion- 1 - Question 1

(Direction 1 - 21)Write down the correct answers. Each question carries one mark.

Q. Which of the following statements is correct?

Detailed Solution for Test: Measures Of Central Tendency And Dispersion- 1 - Question 1

To answer this question, we need to understand the concepts of central tendency and dispersion in statistics.
Central Tendency:
Central tendency refers to the measure that represents the center or average of a distribution. The commonly used measures of central tendency are mean, median, and mode.
Dispersion:
Dispersion refers to the variability or spread of data points in a distribution. The commonly used measures of dispersion are range, variance, and standard deviation.
Now let's analyze the given options:
Option A: Two distributions may have identical measures of central tendency and dispersion.
- This statement is correct. It is possible for two distributions to have the same measures of central tendency (mean, median, or mode) and dispersion (range, variance, or standard deviation).
Option B: Two distributions may have identical measures of central tendency but different measures of dispersion.
- This statement is also correct. It is possible for two distributions to have the same measures of central tendency (mean, median, or mode) but different measures of dispersion (range, variance, or standard deviation).
Option C: Two distributions may have different measures of central tendency but identical measures of dispersion.
- This statement is correct as well. It is possible for two distributions to have different measures of central tendency (mean, median, or mode) but the same measures of dispersion (range, variance, or standard deviation).
Therefore, the correct answer is Option D: All the statements (a), (b), and (c).
In summary, two distributions can have the same or different measures of central tendency and dispersion. The measures of central tendency and dispersion are independent of each other and can vary between distributions.
Test: Measures Of Central Tendency And Dispersion- 1 - Question 2

Dispersion measures

Detailed Solution for Test: Measures Of Central Tendency And Dispersion- 1 - Question 2
Dispersion measures
Definition: Dispersion measures, also known as measures of variability or spread, are statistical measures that describe the scatterness or concentration of a set of observations.
Key Points:
- Dispersion measures provide information about the extent to which data points deviate from the central tendency or mean of a distribution.
- They are used to assess the variability and spread of data, which can help in understanding the distribution and making inferences about the population.
- Dispersion measures are important in various fields such as finance, economics, and social sciences, where understanding the variability of data is crucial for decision-making and analysis.
- There are several common dispersion measures, including range, interquartile range, variance, and standard deviation.
- Each dispersion measure has its own advantages and limitations, and the choice of measure depends on the nature of the data and the research question.
- The range is the simplest dispersion measure and represents the difference between the maximum and minimum values in a dataset.
- The interquartile range (IQR) is a robust measure of dispersion that measures the spread between the first quartile (25th percentile) and third quartile (75th percentile) of a dataset.
- Variance is a widely used dispersion measure that calculates the average of the squared differences between each data point and the mean. It provides a measure of the average deviation of data points from the mean.
- Standard deviation is the square root of the variance and provides a measure of the typical distance between each data point and the mean. It is often used as a more intuitive measure of dispersion compared to variance.
- Other dispersion measures include the mean absolute deviation (MAD), coefficient of variation, and range-based measures such as the mean absolute deviation from the median (MAD-M) and median absolute deviation from the median (MAD-MAD).
Conclusion:
Dispersion measures are essential statistical tools that help in understanding the scatterness or concentration of a set of observations. They provide valuable information about the variability and spread of data, allowing researchers and analysts to make informed decisions and draw meaningful conclusions from their analyses.
1 Crore+ students have signed up on EduRev. Have you? Download the App
Test: Measures Of Central Tendency And Dispersion- 1 - Question 3

When it comes to comparing two or more distributions we consider

Detailed Solution for Test: Measures Of Central Tendency And Dispersion- 1 - Question 3
Comparison of Distributions: Absolute vs Relative Measures of Dispersion
When comparing two or more distributions, it is important to consider the measures of dispersion, which provide insights into the spread or variability of the data. There are two types of measures of dispersion: absolute and relative. Let's discuss each of them in detail:
Absolute Measures of Dispersion:
- Absolute measures of dispersion directly quantify the variability of the data in terms of the units of measurement. They provide an absolute value that indicates the spread of the data points.
- Commonly used absolute measures of dispersion include range, mean deviation, variance, and standard deviation.
- Range: It is the difference between the maximum and minimum values in the dataset. It gives a rough estimate of the spread but is highly influenced by extreme values.
- Mean Deviation: It measures the average distance of each data point from the mean. However, it does not consider the direction of deviation.
- Variance: It measures the average squared deviation from the mean. It provides a more comprehensive understanding of the dispersion but is influenced by extreme values.
- Standard Deviation: It is the square root of the variance and provides a measure of dispersion in the original units of measurement. It is widely used as it is more interpretable and less affected by extreme values compared to variance.
Relative Measures of Dispersion:
- Relative measures of dispersion express the variability of the data in relative terms, without reference to the units of measurement. They provide a dimensionless value, allowing for easy comparison between distributions with different units.
- Commonly used relative measures of dispersion include coefficient of variation and relative standard deviation.
- Coefficient of Variation (CV): It is the ratio of the standard deviation to the mean, expressed as a percentage. It is useful when comparing distributions with different means or units of measurement.
- Relative Standard Deviation (RSD): It is the ratio of the standard deviation to the mean, expressed as a decimal or percentage. It is also useful for comparing distributions with different means or units.
Conclusion:
When comparing two or more distributions, it is essential to consider both absolute and relative measures of dispersion. Absolute measures provide insights into the spread of the data in the original units of measurement, while relative measures allow for comparison between distributions with different units or means. Therefore, the correct answer is option B: Relative measures of dispersion.
Test: Measures Of Central Tendency And Dispersion- 1 - Question 4

Which one is difficult to compute?

Detailed Solution for Test: Measures Of Central Tendency And Dispersion- 1 - Question 4

Detailed


Introduction:
The question asks which measure of dispersion is difficult to compute. Dispersion refers to the spread or variability of a dataset. There are two types of measures of dispersion: relative measures and absolute measures.
Explanation:
To determine which measure of dispersion is difficult to compute, let's examine the options given in the question.
A: Relative measures of dispersion:
- Relative measures of dispersion include coefficient of variation, relative range, and relative standard deviation.
- These measures express the dispersion relative to the mean or average of the data.
- Computing relative measures of dispersion involves multiple steps and calculations, such as finding the mean, standard deviation, and dividing them.
- The calculations may require more time and effort compared to absolute measures of dispersion.
B: Absolute measures of dispersion:
- Absolute measures of dispersion include range, mean deviation, and variance.
- These measures provide information about the spread of the data without reference to the mean.
- Computing absolute measures of dispersion involves simpler calculations, such as finding the difference between the highest and lowest values (range) or the average deviation from the mean (mean deviation).
- The calculations for absolute measures of dispersion are generally straightforward and less complex compared to relative measures.
C: Both a) and b):
- This option suggests that both relative and absolute measures of dispersion are difficult to compute, which is not accurate.
- While relative measures may be more complex than absolute measures, it doesn't mean both are equally difficult.
D: Range:
- Range is a simple measure of dispersion that represents the difference between the highest and lowest values in a dataset.
- Computing the range involves finding the maximum and minimum values, which is a straightforward process.
Conclusion:
Based on the analysis above, the correct answer is A: Relative measures of dispersion. Relative measures of dispersion require more complex calculations compared to absolute measures and may be more challenging to compute.
Test: Measures Of Central Tendency And Dispersion- 1 - Question 5

Which one is an absolute measure of dispersion?

Detailed Solution for Test: Measures Of Central Tendency And Dispersion- 1 - Question 5
Absolute Measure of Dispersion
An absolute measure of dispersion is a statistical measure that provides a numerical value indicating the spread or variability of a dataset. It gives an absolute quantity that is not dependent on the units of measurement. Out of the given options, the absolute measure of dispersion is:
Range:
- The range is the simplest measure of dispersion and is calculated by subtracting the minimum value from the maximum value in a dataset.
- It gives the absolute difference between the highest and lowest values in a dataset.
- The range is not affected by the distribution of the data or the presence of outliers.
Mean Deviation:
- The mean deviation is a measure of dispersion that calculates the average absolute difference between each data point and the mean of the dataset.
- It provides an absolute measure of dispersion, but it is affected by the distribution of the data and is not as commonly used as other measures.
Standard Deviation:
- The standard deviation is a widely used measure of dispersion that calculates the average distance between each data point and the mean of the dataset.
- It provides an absolute measure of dispersion and takes into account the distribution of the data.
- The standard deviation is considered a more robust measure of dispersion compared to the range and mean deviation.
Conclusion:
- All the given options, Range, Mean Deviation, and Standard Deviation, are measures of dispersion.
- However, the standard deviation is considered the most reliable and commonly used absolute measure of dispersion.
- Therefore, the correct answer is D: All these measures.
Test: Measures Of Central Tendency And Dispersion- 1 - Question 6

Which measure of dispersion is the quickest to compute?

Detailed Solution for Test: Measures Of Central Tendency And Dispersion- 1 - Question 6
Quickest measure of dispersion:
The quickest measure of dispersion is the Range.
Explanation:
To determine the quickest measure of dispersion, let's consider the time required to compute each measure:
Standard deviation:
- Calculation of standard deviation involves multiple steps, including calculating the mean, subtracting each data point from the mean, squaring the differences, summing the squared differences, and finally taking the square root.
- This process can be time-consuming, especially for larger data sets.
Quartile deviation:
- Quartile deviation involves finding the upper and lower quartiles.
- This requires sorting the data set and then finding the values at the 25th and 75th percentiles.
- While this process is quicker than calculating standard deviation, it still requires sorting and locating specific percentiles.
Mean deviation:
- Mean deviation involves finding the average of the absolute differences between each data point and the mean.
- This requires calculating the mean and then finding the absolute differences.
- Although it is simpler than calculating standard deviation, it still involves multiple steps.
Range:
- The range is the simplest measure of dispersion.
- It only requires finding the difference between the maximum and minimum values in the data set.
- This can be done quickly without any complex calculations.
Conclusion:
Based on the time required for computation, the Range is the quickest measure of dispersion. It only involves finding the difference between the maximum and minimum values in the data set, making it the most efficient option.
Test: Measures Of Central Tendency And Dispersion- 1 - Question 7

Which measures of dispersions is not affected by the presence of extreme observations?

Detailed Solution for Test: Measures Of Central Tendency And Dispersion- 1 - Question 7
Explanation:
The measure of dispersion refers to the spread or variability of the data points in a dataset. It helps in understanding how spread out the data is from the central tendency (mean, median, mode). Extreme observations or outliers can greatly influence the measures of dispersion. However, there is one measure of dispersion that is not affected by the presence of extreme observations:
Quartile Deviation:
- Quartile Deviation is a measure of dispersion that is not affected by extreme observations.
- It is calculated as the difference between the third quartile (Q3) and the first quartile (Q1) of the data.
- Quartile Deviation only considers the middle 50% of the data, ignoring the extreme values.
- It provides a measure of dispersion that is resistant to outliers.
Other measures of dispersion, such as Range, Mean Deviation, and Standard Deviation, are influenced by extreme observations:
Range:
- Range is the difference between the maximum and minimum values in a dataset.
- It is greatly affected by extreme observations as it considers the full range of values.
Mean Deviation:
- Mean Deviation is the average of the absolute differences between each data point and the mean.
- It is affected by extreme observations as it considers the distance of each data point from the mean.
Standard Deviation:
- Standard Deviation is a measure of dispersion that represents the average distance of each data point from the mean.
- It is greatly influenced by extreme observations, as it takes into account the squared differences between each data point and the mean.
In conclusion, Quartile Deviation is the measure of dispersion that is not affected by the presence of extreme observations. Range, Mean Deviation, and Standard Deviation are all influenced by extreme observations.
Test: Measures Of Central Tendency And Dispersion- 1 - Question 8

Which measure of dispersion is based on the absolute deviations only?

Detailed Solution for Test: Measures Of Central Tendency And Dispersion- 1 - Question 8
Mean Deviation
- Mean deviation is a measure of dispersion that is based on the absolute deviations from the mean.
- It calculates the average of the absolute differences between each data point and the mean.
- The absolute deviation is the absolute value of the difference between each data point and the mean.
- The formula for mean deviation is:
- Mean Deviation = Σ | x - μ | / N, where x is each data point, μ is the mean, and N is the number of data points.
- Mean deviation gives an indication of how spread out the data points are from the mean.
- It is less influenced by extreme values compared to other measures of dispersion.
- Mean deviation is useful when analyzing data sets with outliers or skewed distributions.
- However, it is not commonly used in statistical analysis compared to other measures of dispersion like standard deviation.
Test: Measures Of Central Tendency And Dispersion- 1 - Question 9

Which measure is based on only the central fifty percent of the observations?

Detailed Solution for Test: Measures Of Central Tendency And Dispersion- 1 - Question 9
Which measure is based on only the central fifty percent of the observations?
The measure that is based on only the central fifty percent of the observations is the Quartile deviation.
Explanation:
Quartile deviation is a statistical measure that indicates the spread or dispersion of a dataset. It is calculated as half the difference between the third quartile (Q3) and the first quartile (Q1).
Here's a breakdown of the options and why the quartile deviation is the correct answer:
- Standard deviation: The standard deviation takes into account all the observations in a dataset and measures the average distance of each data point from the mean. It is not based solely on the central fifty percent of the observations.
- Quartile deviation: As mentioned earlier, the quartile deviation only considers the range between the first and third quartiles, which represents the central fifty percent of the observations. It provides a measure of dispersion that is less affected by extreme values or outliers.
- Mean deviation: The mean deviation, also known as average absolute deviation, measures the average absolute difference between each data point and the mean of the dataset. It is not specifically based on the central fifty percent of the observations.
Therefore, the correct answer is Quartile deviation (B), as it is the measure that is based on only the central fifty percent of the observations.
Test: Measures Of Central Tendency And Dispersion- 1 - Question 10

Which measure of dispersion is based on all the observations?

Detailed Solution for Test: Measures Of Central Tendency And Dispersion- 1 - Question 10
Measure of Dispersion Based on All Observations:
The measure of dispersion that is based on all the observations is the standard deviation.
Explanation:
- Standard deviation is a statistical measure that calculates the average distance between each data point and the mean of the data set. It takes into account all the observations in the dataset.
- It provides a measure of how spread out the data is from the mean value.
- Standard deviation is widely used in various fields such as finance, engineering, and social sciences to understand the variability or dispersion of data.
- It is calculated by taking the square root of the variance, which is the average of the squared differences between each data point and the mean.
- Standard deviation is considered to be a more robust measure of dispersion compared to other measures like mean deviation or quartile deviation because it takes into account the magnitude and direction of the differences.
- By considering all the observations, the standard deviation provides a comprehensive understanding of the variability of the data set.
Therefore, the correct answer is (D) (a) and (b) but not (c). Both mean deviation and standard deviation are measures of dispersion based on all the observations in the dataset.
Test: Measures Of Central Tendency And Dispersion- 1 - Question 11

The appropriate measure of dispersions for open – end classification is

Detailed Solution for Test: Measures Of Central Tendency And Dispersion- 1 - Question 11
Appropriate measure of dispersions for open-end classification:
The appropriate measure of dispersions for open-end classification is the Quartile Deviation.
Explanation:
- Open-end classification refers to a situation where the data is grouped into categories or intervals with the last interval being open-ended, meaning it does not have an upper limit.
- In such cases, the data is not continuous, and therefore measures like standard deviation and mean deviation are not appropriate as they assume continuous data.
- Quartile deviation, also known as semi-interquartile range, is a measure of dispersion that is suitable for open-end classification.
- Quartile deviation is calculated as the difference between the third quartile (Q3) and the first quartile (Q1) divided by 2.
- It is less affected by extreme values compared to other measures of dispersion and provides a measure of the spread of the middle 50% of the data.
- Quartile deviation is particularly useful when dealing with data that is not normally distributed or has outliers.
- Therefore, the appropriate measure of dispersion for open-end classification is the Quartile Deviation.
Conclusion:
The appropriate measure of dispersion for open-end classification is the Quartile Deviation. It is a robust measure that is not affected by extreme values and provides a measure of the spread of the middle 50% of the data.
Test: Measures Of Central Tendency And Dispersion- 1 - Question 12

The most commonly used measure of dispersion is

Detailed Solution for Test: Measures Of Central Tendency And Dispersion- 1 - Question 12
Most commonly used measure of dispersion:
The most commonly used measure of dispersion is the Standard Deviation.
Explanation:
- Dispersion refers to the spread or variability of a set of data points.
- It provides information about how the data points are distributed around the mean or average value.
- The measure of dispersion helps in understanding the range and variability of the data set.
- The standard deviation is a widely used measure of dispersion because it takes into account all the data points and provides a more accurate representation of the variability.
Comparison with other measures of dispersion:
- Range: The range is the simplest measure of dispersion. It is the difference between the maximum and minimum values in a data set. However, it only considers two data points and does not take into account the entire data set.
- Coefficient of Variation: The coefficient of variation is the ratio of the standard deviation to the mean. It is used to compare the variability of different data sets with different means. However, it may not be applicable in cases where the mean is close to zero or negative.
- Quartile Deviation: The quartile deviation is the difference between the upper quartile and lower quartile of a data set. It provides information about the variability around the median. However, it does not consider all the data points and may not provide a comprehensive picture of the dispersion.
Conclusion:
- While there are various measures of dispersion available, the standard deviation is the most commonly used measure due to its comprehensive consideration of all data points and accurate representation of variability.
Test: Measures Of Central Tendency And Dispersion- 1 - Question 13

Which measure of dispersion has some desirable mathematical properties?

Detailed Solution for Test: Measures Of Central Tendency And Dispersion- 1 - Question 13
Measure of dispersion:

Dispersion refers to how spread out or scattered the data values are in a dataset. Measures of dispersion provide information about the variability or spread of the data. Some common measures of dispersion include the standard deviation, mean deviation, and quartile deviation.
Desirable mathematical properties:

When choosing a measure of dispersion, it is desirable to consider certain mathematical properties that make the measure more useful and informative. These properties include:
1. Additivity: The measure of dispersion should be additive, meaning that it can be calculated for subsets of the data and then combined to obtain the dispersion of the entire dataset. This property allows for easy comparison and aggregation of dispersion values.
2. Non-negativity: The measure of dispersion should always be non-negative, meaning that it cannot be negative. This property ensures that the measure provides a meaningful and valid representation of the variability in the data.
3. Efficiency: The measure of dispersion should efficiently capture the spread of the data. It should provide a reliable indication of how spread out the values are, allowing for accurate comparisons between datasets.
Measures of dispersion and their properties:

Now let's consider the specific measures of dispersion mentioned in the question and their desirable mathematical properties:
- Standard deviation: The standard deviation has all the desirable mathematical properties mentioned above. It is additive, non-negative, and efficiently captures the spread of the data. This makes it a widely used and reliable measure of dispersion.
- Mean deviation: The mean deviation does not have the additivity property, as it cannot be easily calculated for subsets of the data and combined. However, it is non-negative and provides a measure of spread, although it may not be as efficient as the standard deviation.
- Quartile deviation: The quartile deviation also lacks the additivity property, but it is non-negative and captures the spread of the middle 50% of the data. However, it may not provide as comprehensive information about the overall dispersion of the dataset.
Conclusion:

Among the measures of dispersion mentioned, the standard deviation has all the desirable mathematical properties, making it a preferred choice in many statistical analyses. However, it is important to consider the specific characteristics of the dataset and the research question when choosing an appropriate measure of dispersion.
Test: Measures Of Central Tendency And Dispersion- 1 - Question 14

If the profits of a company remains the same for the last ten months, then the standard deviation of profits for these ten months would be ?

Detailed Solution for Test: Measures Of Central Tendency And Dispersion- 1 - Question 14

To determine the standard deviation of profits for the last ten months, we need to consider the following points:
1. Standard deviation: Standard deviation is a measure of the dispersion or variability of a set of data values. It quantifies the amount of variation or spread in a dataset.
2. Profits: Profits refer to the financial gain earned by a company after deducting all expenses from revenue.
3. Same profits: If the profits of a company remain the same for the last ten months, it means that the profit value for each month is identical.
Now let's analyze the given options:
A: Positive: The standard deviation can never be negative as it represents a measure of spread and cannot have a negative value.
B: Negative: Same as option A, the standard deviation cannot be negative.
C: Zero: If the profits of a company remain the same for the last ten months, it means there is no variation or spread in the profit values. Therefore, the standard deviation would be zero.
D: (a) or (c): Since option A is incorrect and option C is correct, the answer is (c).
In conclusion, if the profits of a company remain the same for the last ten months, the standard deviation of profits for these ten months would be zero (Option C).
Test: Measures Of Central Tendency And Dispersion- 1 - Question 15

Which measure of dispersion is considered for finding a pooled measure of dispersion after combining several groups?

Detailed Solution for Test: Measures Of Central Tendency And Dispersion- 1 - Question 15
Measure of Dispersion for Finding a Pooled Measure of Dispersion:
To find a pooled measure of dispersion after combining several groups, the most suitable measure of dispersion is the standard deviation. Here's a detailed explanation:
1. Introduction:
- When dealing with multiple groups or populations, it is common to combine the data to obtain an overall measure of dispersion.
- The pooled measure of dispersion provides a summary of the variability across all the groups.
2. Standard Deviation:
- The standard deviation is a measure of dispersion that quantifies the spread or variability of a dataset.
- It measures how much the values in a dataset deviate from the mean.
- The formula for calculating the standard deviation takes into account all the individual values in the dataset.
3. Advantages of Using Standard Deviation:
- The standard deviation is widely used because it considers the individual values, giving more weight to extreme values.
- It provides a more accurate measure of dispersion compared to other measures such as mean deviation or quartile deviation.
4. Pooled Measure of Dispersion:
- When combining several groups, the pooled measure of dispersion is obtained by calculating the standard deviation of the combined dataset.
- This approach takes into account the variability within each group and provides an overall measure of dispersion for the combined data.
5. Other Measures of Dispersion:
- While the standard deviation is the most commonly used measure for finding a pooled measure of dispersion, other measures such as mean deviation or quartile deviation can also be used.
- However, these alternative measures may not capture the full extent of the variability in the combined dataset.
In conclusion, the standard deviation is considered the most appropriate measure of dispersion for finding a pooled measure of dispersion after combining several groups. It provides a comprehensive assessment of the spread of values across the combined dataset, taking into account the individual values and their deviations from the mean.
Test: Measures Of Central Tendency And Dispersion- 1 - Question 16

A shift of origin has no impact on

Detailed Solution for Test: Measures Of Central Tendency And Dispersion- 1 - Question 16
Explanation:
A shift of origin refers to shifting the starting point or origin of a dataset. It means adding or subtracting a constant value from each data point in the dataset. In this context, the answer choice d states that a shift of origin has no impact on the range, mean deviation, standard deviation, and quartile deviation. Let's analyze each of these measures individually:
1. Range: The range is the difference between the maximum and minimum values in a dataset. Shifting the origin by a constant value does not change the relative positions of the maximum and minimum values, so the range remains unchanged.
2. Mean deviation: The mean deviation is the average of the absolute differences between each data point and the mean of the dataset. Shifting the origin by a constant value does not affect the mean of the dataset or the absolute differences between the data points and the mean. Therefore, the mean deviation remains unchanged.
3. Standard deviation: The standard deviation measures the spread or dispersion of data points around the mean. Shifting the origin by a constant value does not change the relative distances between the data points and the mean. Hence, the standard deviation remains unaffected.
4. Quartile deviation: The quartile deviation is a measure of dispersion that represents the spread between the first quartile (Q1) and the third quartile (Q3). Similar to the standard deviation, shifting the origin by a constant value does not change the relative positions of the quartiles, so the quartile deviation remains the same.
Therefore, we can conclude that a shift of origin has no impact on the range, mean deviation, standard deviation, and quartile deviation.
Test: Measures Of Central Tendency And Dispersion- 1 - Question 17

The range of 15, 12, 10, 9, 17, 20 is

Detailed Solution for Test: Measures Of Central Tendency And Dispersion- 1 - Question 17

To find the range of a set of numbers, we need to subtract the smallest number from the largest number.
Given set of numbers: 15, 12, 10, 9, 17, 20
1. Arrange the numbers in ascending order: 9, 10, 12, 15, 17, 20
2. The smallest number in the set is 9 and the largest number is 20.
3. Subtract the smallest number from the largest number: 20 - 9 = 11.
Therefore, the range of the given set of numbers is 11.
Answer: D. 11
Test: Measures Of Central Tendency And Dispersion- 1 - Question 18

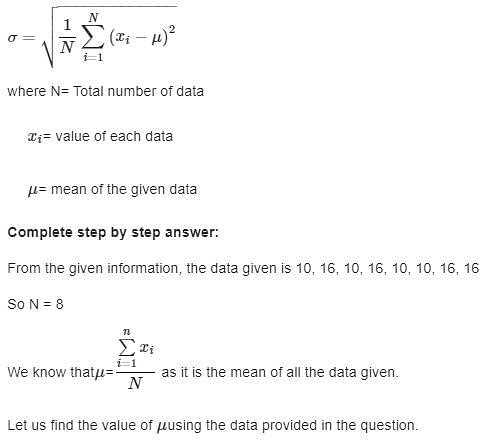
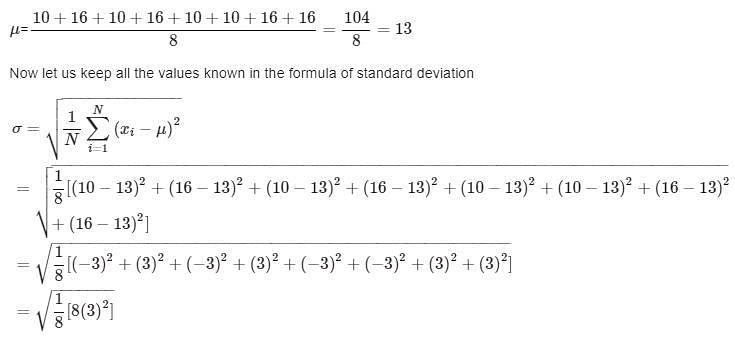
The standard deviation of, 10, 16, 10, 16, 10, 10, 16, 16 is

Detailed Solution for Test: Measures Of Central Tendency And Dispersion- 1 - Question 18

The Standard Deviation is a measure of how spread out numbers are. To calculate the standard deviation of those numbers, we just need to do the following steps.
1. Find the value of Mean of the given numbers(the simple average of the numbers)
2. Then for each number: subtract the Mean and square the result
3. Then work out the mean of those squared differences.
4. Take the square root of the resulted value and we are done.
By converting the above statements into a formula we get
The formula for finding standard deviation(σ) is

= 3.
Therefore the standard deviation of the given numbers 10, 16, 10, 16, 10, 10, 16, 16 is 3.

Test: Measures Of Central Tendency And Dispersion- 1 - Question 19

For any two numbers SD is always

Detailed Solution for Test: Measures Of Central Tendency And Dispersion- 1 - Question 19
Explanation:
To determine the relationship between the standard deviation (SD) and the range of two numbers, it is important to understand the definitions of these terms.
- The range of a set of numbers is the difference between the maximum and minimum values in the set.
- The standard deviation is a measure of the dispersion or spread of a set of numbers. It quantifies how much the numbers deviate from the mean.
Now, let's consider two numbers, A and B, with A being the smaller number and B being the larger number.
- The range of these two numbers will be B - A.
- The standard deviation of these two numbers will depend on the values of A and B and their relative positions to the mean.
Claim: The standard deviation (SD) is always half of the range.
Explanation:
To prove this claim, let's consider the following scenarios:
1. Scenario: A is close to the mean and B is far from the mean.
- In this scenario, the range will be large (B - A) and the standard deviation will also be large, indicating a greater spread of the numbers.
2. Scenario: A is far from the mean and B is close to the mean.
- In this scenario, the range will be large (B - A) and the standard deviation will also be large, indicating a greater spread of the numbers.
From the above scenarios, we can conclude that the range and the standard deviation are related but not directly proportional. Therefore, the statement "SD is always twice the range" is incorrect.
However, it is important to note that the standard deviation can be less than half of the range in certain scenarios where the numbers are distributed more evenly around the mean.
Therefore, the correct answer is B: Half of the range.
Test: Measures Of Central Tendency And Dispersion- 1 - Question 20

If all the observations are increased by 10, then

Detailed Solution for Test: Measures Of Central Tendency And Dispersion- 1 - Question 20
Explanation:
To understand the effect of increasing all the observations by 10 on the measures of dispersion, let's consider the different measures of dispersion and analyze their behavior:
Standard Deviation (SD):
- The standard deviation measures the spread or dispersion of the data points around the mean.
- When all the observations are increased by 10, the distance between each observation and the mean is increased by 10 as well.
- This means that the spread or dispersion of the data points would also increase by 10.
- Therefore, the standard deviation would be increased by 10.
Mean Deviation:
- The mean deviation measures the average distance between each observation and the mean.
- When all the observations are increased by 10, the difference between each observation and the mean would also increase by 10.
- This means that the average distance between each observation and the mean would also increase by 10.
- Therefore, the mean deviation would be increased by 10.
Quartile Deviation:
- The quartile deviation measures the spread of the middle 50% of the data points.
- When all the observations are increased by 10, the range of the middle 50% of the data points would also increase by 10.
- This means that the quartile deviation would be increased by 10.
Conclusion:
- When all the observations are increased by 10, the standard deviation, mean deviation, and quartile deviation would all be increased by 10.
- Therefore, the correct answer is option D: All these three remain unchanged.
Test: Measures Of Central Tendency And Dispersion- 1 - Question 21

If all the observations are multiplied by 2, then

Detailed Solution for Test: Measures Of Central Tendency And Dispersion- 1 - Question 21
Explanation:
To understand how the standard deviation (SD) changes when all the observations are multiplied by 2, we need to understand the concept of standard deviation.
The standard deviation is a measure of the spread of data points around the mean. It tells us how much the data deviates from the average. When we multiply all the observations by a constant, it affects both the mean and the spread of the data.
Key Points:
- Multiplying all the observations by a constant does not change the spread of the data.
- It only changes the scale or magnitude of the data.
- The standard deviation is a measure of the spread or variability of the data, so it is affected by the scale or magnitude of the data.
- When all the observations are multiplied by 2, the spread of the data doubles, and therefore, the standard deviation also doubles.
Therefore, the correct answer is:
A: New SD would be also multiplied by 2.
Test: Measures Of Central Tendency And Dispersion- 1 - Question 22

(Dirction 22 - 40) Write down the correct answers. Each question carries two marks.

Q. What is the coefficient of range for the following wages of 8 workers?

Rs.80, Rs.65, Rs.90, Rs.60, Rs.75, Rs.70, Rs.72, Rs.85.

Detailed Solution for Test: Measures Of Central Tendency And Dispersion- 1 - Question 22

To find the coefficient of range, follow these steps:

  1. Find the Range:

    • Maximum wage H = Rs. 90
    • Minimum wage L = Rs. 60
    • Range = Maximum wage - Minimum wage
    Range=90−60=30
  2. Calculate the Coefficient of Range: The coefficient of range is given by:


Test: Measures Of Central Tendency And Dispersion- 1 - Question 23

If Rx and Ry denote ranges of x and y respectively where x and y are related by 3x+2y+10=0, what would be the relation between x and y?

Detailed Solution for Test: Measures Of Central Tendency And Dispersion- 1 - Question 23

The given equation is 3x + 2y = 10.


To find the relation between x and y, we need to determine the ranges of x and y.

Step 1: Solve the equation for x in terms of y:


3x + 2y = 10


3x = 10 - 2y


x = (10 - 2y)/3


Step 2: Find the range of y:


To find the range of y, we need to determine the values of y that satisfy the equation.


Let's consider the extreme values of y:


When y is at its maximum, x will be at its minimum.


When y is at its minimum, x will be at its maximum.


Substituting these extreme values of y into the equation, we can find the corresponding values of x:


When y is at its maximum, let y = ymax:


x = (10 - 2ymax)/3


When y is at its minimum, let y = ymin:


x = (10 - 2ymin)/3


Therefore, the range of y is (ymin, ymax).


Step 3: Find the range of x:


To find the range of x, we need to determine the values of x that satisfy the equation.


Let's consider the extreme values of x:


When x is at its maximum, y will be at its minimum.


When x is at its minimum, y will be at its maximum.


Substituting these extreme values of x into the equation, we can find the corresponding values of y:


When x is at its maximum, let x = xmax:


3xmax + 2y = 10


y = (10 - 3xmax)/2


When x is at its minimum, let x = xmin:


3xmin + 2y = 10


y = (10 - 3xmin)/2


Therefore, the range of x is (xmin, xmax).


Conclusion:

From the analysis above, we can conclude that the relation between x and y is:


3 Rx = 2 Ry


Answer: C. 3 Rx = 2 Ry
Test: Measures Of Central Tendency And Dispersion- 1 - Question 24

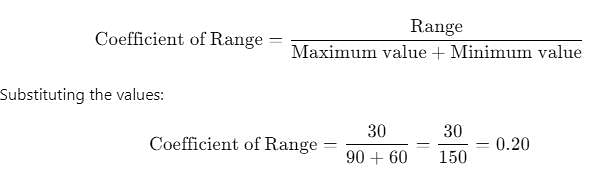
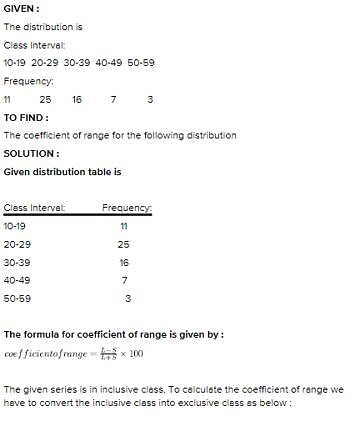
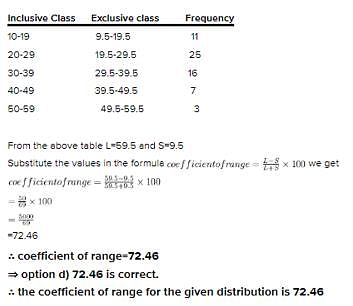
What is the coefficient of range for the following distribution?

Detailed Solution for Test: Measures Of Central Tendency And Dispersion- 1 - Question 24


Test: Measures Of Central Tendency And Dispersion- 1 - Question 25

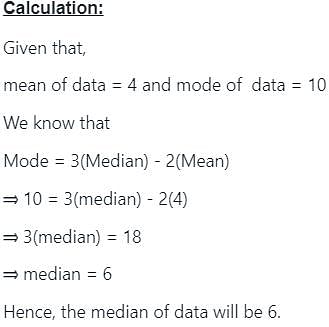
If mean and mode of some data are 4 & 10 respectively, its median will be:

Detailed Solution for Test: Measures Of Central Tendency And Dispersion- 1 - Question 25

Test: Measures Of Central Tendency And Dispersion- 1 - Question 26

What is the value of mean deviation about mean for the following numbers?

5, 8, 6, 3, 4.

Detailed Solution for Test: Measures Of Central Tendency And Dispersion- 1 - Question 26
Mean Deviation about Mean:
Mean deviation about mean is a measure of the average distance between each data point and the mean of the data set. It is calculated by finding the difference between each data point and the mean, taking the absolute value of each difference, and then finding the mean of those absolute differences.
Given Numbers:
5, 8, 6, 3, 4
Step-by-Step
1. Find the mean of the given numbers.
- Mean = (5 + 8 + 6 + 3 + 4) / 5 = 26 / 5 = 5.2
2. Find the difference between each data point and the mean.
- Differences: (5 - 5.2), (8 - 5.2), (6 - 5.2), (3 - 5.2), (4 - 5.2)
- Differences: (-0.2), (2.8), (0.8), (-2.2), (-1.2)
3. Take the absolute value of each difference.
- Absolute Differences: 0.2, 2.8, 0.8, 2.2, 1.2
4. Find the mean of the absolute differences.
- Mean of Absolute Differences = (0.2 + 2.8 + 0.8 + 2.2 + 1.2) / 5 = 7.2 / 5 = 1.44
Answer:
The value of mean deviation about mean for the given numbers is 1.44. Therefore, the correct answer is option C.
Test: Measures Of Central Tendency And Dispersion- 1 - Question 27

Median in set 6, 4, 2, 3, 4, 5, 5, 4 would be

Detailed Solution for Test: Measures Of Central Tendency And Dispersion- 1 - Question 27
Median in set 6, 4, 2, 3, 4, 5, 5, 4 would be 4.
To find the median in a set of numbers, follow these steps:
1. Arrange the numbers in ascending order: 2, 3, 4, 4, 4, 5, 5, 6.
2. Determine the middle number(s) of the set. Since there are 8 numbers, the middle would be between the 4th and 5th numbers.
3. In this case, the 4th and 5th numbers are both 4.
4. Since there are two middle numbers, the median would be the average of these two numbers.
5. Therefore, the median in this set is 4.
Summary:
The median in the set 6, 4, 2, 3, 4, 5, 5, 4 is 4.
Test: Measures Of Central Tendency And Dispersion- 1 - Question 28

The coefficient of mean deviation about mean for the first 9 natural numbers is

Detailed Solution for Test: Measures Of Central Tendency And Dispersion- 1 - Question 28

To calculate the coefficient of mean deviation about mean, we need to follow these steps:
1. Find the mean of the given data set.
2. Calculate the absolute deviations of each data point from the mean.
3. Find the mean of these absolute deviations.
4. Finally, calculate the coefficient of mean deviation by dividing the mean absolute deviation by the mean.
Now let's calculate the coefficient of mean deviation about mean for the first 9 natural numbers:
1. Find the mean of the given data set:
- The sum of the first 9 natural numbers is 1 + 2 + 3 + 4 + 5 + 6 + 7 + 8 + 9 = 45.
- The mean is calculated by dividing the sum by the number of data points, which is 45/9 = 5.
2. Calculate the absolute deviations of each data point from the mean:
- The absolute deviations from the mean are |1 - 5|, |2 - 5|, |3 - 5|, |4 - 5|, |5 - 5|, |6 - 5|, |7 - 5|, |8 - 5|, |9 - 5|.
- These absolute deviations are 4, 3, 2, 1, 0, 1, 2, 3, 4.
3. Find the mean of these absolute deviations:
- The sum of these absolute deviations is 4 + 3 + 2 + 1 + 0 + 1 + 2 + 3 + 4 = 20.
- The mean of these absolute deviations is calculated by dividing the sum by the number of data points, which is 20/9.
4. Calculate the coefficient of mean deviation:
- The coefficient of mean deviation about mean is calculated by dividing the mean absolute deviation by the mean.
- In this case, the mean absolute deviation is 20/9 and the mean is 5.
- So, the coefficient of mean deviation about mean is (20/9) / 5 = 20/45 = 400/9.
Therefore, the coefficient of mean deviation about mean for the first 9 natural numbers is A: 400/9.
Test: Measures Of Central Tendency And Dispersion- 1 - Question 29

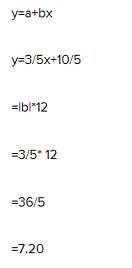
If the relation between x and y is 5y–3x = 10 and the mean deviation about mean for x is 12, then the mean deviation of y about mean is

Detailed Solution for Test: Measures Of Central Tendency And Dispersion- 1 - Question 29

Test: Measures Of Central Tendency And Dispersion- 1 - Question 30

If two variables x and y are related by 2x + 3y –7 =0 and the mean and mean deviation about mean of x are 1 and 0.3 respectively, then the coefficient of mean deviation of y about mean is

Detailed Solution for Test: Measures Of Central Tendency And Dispersion- 1 - Question 30

Given: 2x - 3y - 7 = 0
To find: The coefficient of mean deviation of y about the mean
First, let's solve the given equation to find the relationship between x and y:
2x - 3y - 7 = 0
2x = 3y + 7
x = (3y + 7)/2
Now, we need to find the mean and mean deviation about the mean of x.
Mean of x = 1
Mean deviation about the mean of x = 0.3
To find the mean deviation about the mean of y, we need to substitute the value of x in terms of y into the equation and find the mean deviation of y.
Substituting the value of x:
(3y + 7)/2 = 1
3y + 7 = 2
3y = -5
y = -5/3
Now, let's find the mean deviation about the mean of y:
Mean of y = -5/3
To find the mean deviation about the mean of y, we need to calculate the difference between each value of y and the mean of y, and then find the mean of those differences.
The differences are: (-5/3 - (-5/3)) = 0
Mean deviation about the mean of y = 0
Finally, let's calculate the coefficient of mean deviation of y about the mean:
Coefficient of mean deviation of y about the mean = (Mean deviation about the mean of y / Mean of y) * 100
Coefficient of mean deviation of y about the mean = (0 / (-5/3)) * 100 = 0
Therefore, the coefficient of mean deviation of y about the mean is 0, which is not one of the given options. Hence, the question seems to be incorrect and the correct answer cannot be determined.
View more questions
148 videos|174 docs|99 tests
Information about Test: Measures Of Central Tendency And Dispersion- 1 Page
In this test you can find the Exam questions for Test: Measures Of Central Tendency And Dispersion- 1 solved & explained in the simplest way possible. Besides giving Questions and answers for Test: Measures Of Central Tendency And Dispersion- 1, EduRev gives you an ample number of Online tests for practice

Top Courses for CA Foundation

Download as PDF

Top Courses for CA Foundation