Test: Statistical Description Of Data - 3 - CA Foundation MCQ
30 Questions MCQ Test Quantitative Aptitude for CA Foundation - Test: Statistical Description Of Data - 3

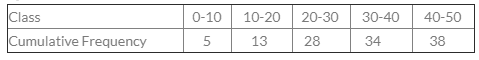
The data given below refers to the marks gained by a group of students:
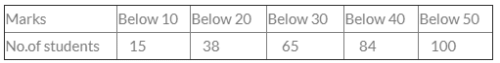
Then the no. of students getting marks more than 30 would be ______________.
Then the no. of students getting marks more than 30 would be ______________.
There were 200 employees in an office in which 150 were married. Total male employees were 160 out of which 120 were married. What was the number of female unmarried employees?

From which graphical representation, we can calculate partition values?
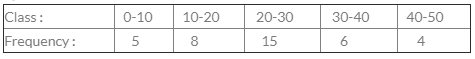
For the class 20-30, cumulative frequency is ?
Difference between the maximum and minimum value of a given data is called
The best method of presentation of data is
A pie diagram is used to represent the following data:
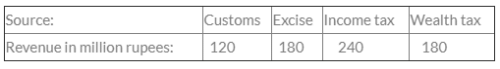
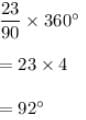
The central angles in the pie diagram corresponding to income tax and wealth tax respectively:
The following data relates to the marks of a group of students.
Marks No. of Students
More than 70% 07
More than 60% 18
More than 50% 40
More than 40% 60
More than 30% 75
More than 20% 100
How many students have got marks less than 50%?
If class interval is 10-14, 15-19, 20-24, then the first class is
Which of the following is not a two dimensional diagram?
The difference between the upper and lower limit of a class is called ___________.
To draw Histogram, the frequency distribution should be:
Cost of Sugar in a month under the heads raw materials, labour, direct production and others were 12, 20, 35 & 23 units respectively. The difference between their central angles for the largest & smallest components of the cost of Sugar is
The breadth of the rectangle is equal to the length of the class interval in
The frequency of class 20-30 in the following data
The Graphical representation by which median is calculated is called
Arrange the following dimension wise : pie-diagram, bar-diagram and cubic diagram.
For the overlapping classes 0-10, 10-20, 20-30 etc. The class mark of the class 0-10 is
The curve obtained by joining the points, whose x-coordinates are the upper limits of the class-intervals and y coordinates are corresponding cumulative frequencies is called
For non-overlapping classes 0-19, 20-39, 40-59 the class mark of the class 0-19 is
The Chronological classification of data are classified on the basis of:
An ogive can be prepared in ____________different ways.
Diagrammatic representation of the cumulative frequency distribution is
For overlapping class-intervals the class limit & class boundary are
Upper boundary of any class coincides with the lower boundary of the next class.
For obtaining frequency polygon we join the successive points whose abscissa represent the corresponding class frequency________
|
101 videos|276 docs|89 tests
|
Important Questions for Statistical Description Of Data - 3
Statistical Description Of Data - 3 MCQs with Answers
Online Tests for Statistical Description Of Data - 3 Quantitative Aptitude for CA Foundation
|
© EduRev
|
Education Revolution
|


|


