Test: Bargraph & Tally Marks - Class 3 MCQ
15 Questions MCQ Test Mathematics for Class 3: NCERT - Test: Bargraph & Tally Marks
| 1 Crore+ students have signed up on EduRev. Have you? Download the App |
The given graph shows the number of books read by pupils in a class from July to December. Study the given graph and answer the following question.
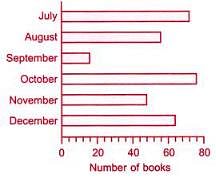
Q. How many books were read altogether from July to November?
DIRECTION: The given bar graph shows the amount of money spent by Amit in a week. Study the graph and answer the questions.
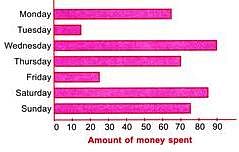
Q. How much more amount Amit spent on Thursday than on Tuesday?
DIRECTION: The given bar graph shows the amount of money spent by Amit in a week. Study the graph and answer the questions.
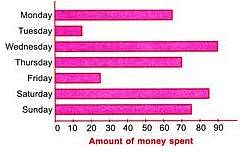
Q. On which day Amit spent Rs. 65?
DIRECTION: The given bar graph shows the amount of money spent by Amit in a week. Study the graph and answer the questions.
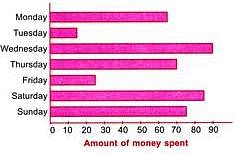
Q. Find the amount of money spent by Amit on Sunday.
DIRECTION: The given bar graph shows the amount of money spent by Amit in a week. Study the graph and answer the questions.
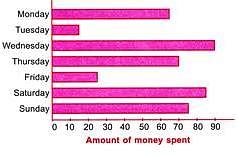
Q. How much less Amount Amit spent on Friday than on Wednesday?
DIRECTION: The given graph shows the number of people who attended a book fair. Study it carefully and answer the following questions.
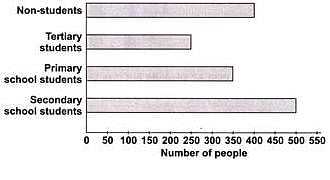
Q. The number of secondary school students was twice the number of________.
DIRECTION: The given graph shows the number of people who attended a book fair. Study it carefully and answer the following questions.
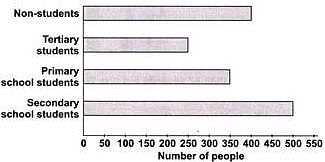
Q. How many less tertiary students attended book fair than primary school students?
DIRECTION: The given graph shows the number of people who attended a book fair. Study it carefully and answer the following questions.
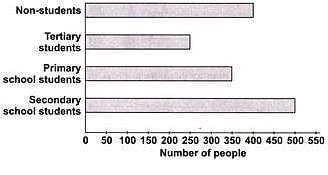
Q. Number of secondary school students are ______ more than non-students.
|
39 videos|119 docs|58 tests
|
|
39 videos|119 docs|58 tests
|


