SSC CGL Exam  >  SSC CGL Tests  >  Quantitative Aptitude for SSC CGL  >  MCQ: Bar Charts - 2 - SSC CGL MCQ

MCQ: Bar Charts - 2 - SSC CGL MCQ


Test Description

15 Questions MCQ Test Quantitative Aptitude for SSC CGL - MCQ: Bar Charts - 2

MCQ: Bar Charts - 2 for SSC CGL 2024 is part of Quantitative Aptitude for SSC CGL preparation. The MCQ: Bar Charts - 2 questions and answers have been prepared according to the SSC CGL exam syllabus.The MCQ: Bar Charts - 2 MCQs are made for SSC CGL 2024 Exam. Find important definitions, questions, notes, meanings, examples, exercises, MCQs and online tests for MCQ: Bar Charts - 2 below.
Solutions of MCQ: Bar Charts - 2 questions in English are available as part of our Quantitative Aptitude for SSC CGL for SSC CGL & MCQ: Bar Charts - 2 solutions in Hindi for Quantitative Aptitude for SSC CGL course. Download more important topics, notes, lectures and mock test series for SSC CGL Exam by signing up for free. Attempt MCQ: Bar Charts - 2 | 15 questions in 15 minutes | Mock test for SSC CGL preparation | Free important questions MCQ to study Quantitative Aptitude for SSC CGL for SSC CGL Exam | Download free PDF with solutions
MCQ: Bar Charts - 2 - Question 1

Direction: The bar graph given below shows the percentage distribution of the total expenditures of a company under various expense heads during 2003.
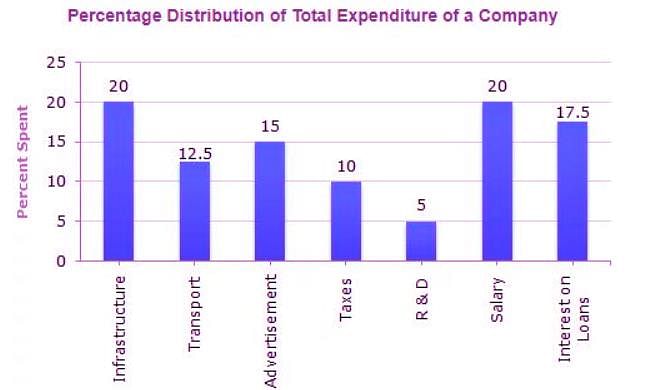
Q. If the interest on loans amounted to Rs. 2.45 crores then the total amount of expenditure on advertisement, taxes and research and development is?

Detailed Solution for MCQ: Bar Charts - 2 - Question 1

Let the total expenditure be Rs. x crores.

Then, 17.5% of x = 2.45 ⇒ x = 14.

∴ Total expenditure = Rs. 14 crores.

and so, the total expenditure on advertisement, taxes and Research and Development

    = Rs. [(15 + 10 + 5)% of 14] crores

    = Rs. [30% of 14] crores

    = Rs. 4.2 crores.

MCQ: Bar Charts - 2 - Question 2

Direction: The bar graph given below shows the percentage distribution of the total expenditures of a company under various expense heads during 2003.
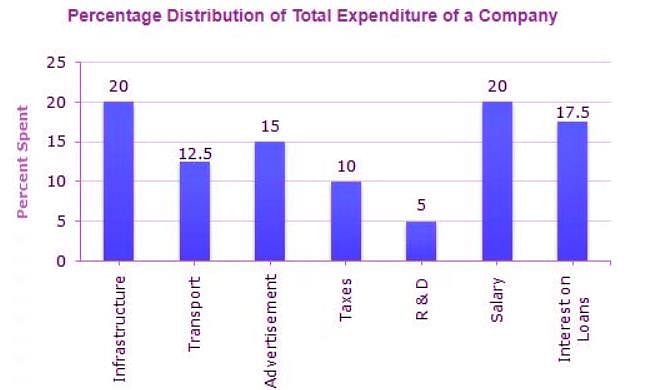
Q. The total amount of expenditures of the company is how many times of expenditure on research and development?

Detailed Solution for MCQ: Bar Charts - 2 - Question 2

Let the total expenditures be Rs. x.

Then, the expenditure on Research and Development (R & D)

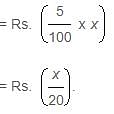
    = Rs. (5% of x)

∴ Ratio of the total expenditure to the expenditure on R & D

Then, the total expenditure is 20 times the expenditure of Research and Development.

1 Crore+ students have signed up on EduRev. Have you? Download the App
MCQ: Bar Charts - 2 - Question 3

Direction: The bar graph given below shows the percentage distribution of the total expenditures of a company under various expense heads during 2003.
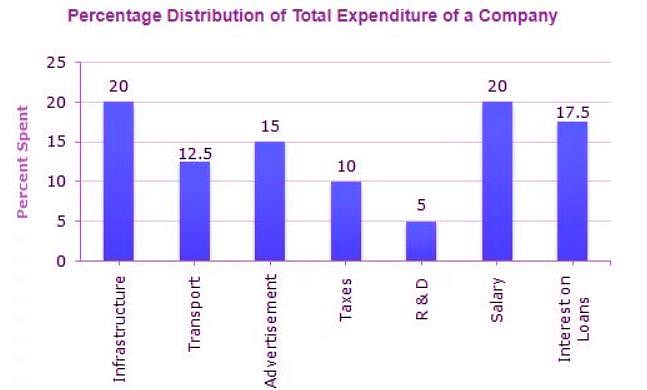
Q. If the expenditure on advertisement is 2.10 crores then the difference between the expenditure on transport and taxes is?

Detailed Solution for MCQ: Bar Charts - 2 - Question 3

Let the total expenditure be Rs. x crores.
Then, 15% of x = 2.10

∴ Total expenditure = Rs. 14 crores

and so, the difference between the expenditures on transport and taxes

    = Rs. [(12.5 - 10)% of 14] crores

    = Rs. [2.5% of 14] crores

    = Rs. 0.35 crores

    = Rs. 35 lakhs

MCQ: Bar Charts - 2 - Question 4

Direction: The bar graph given below shows the percentage distribution of the total expenditures of a company under various expense heads during 2003.

Q. What is the ratio of the total expenditure on infrastructure and transport to the total expenditure on taxes and interest on loans?

Detailed Solution for MCQ: Bar Charts - 2 - Question 4

Let the total amount of expenditures be Rs. x.

Then, the total expenditure on infrastruture and transport

    = Rs. [(20 + 12.5)% of x]

    = Rs. [32.5% of x]

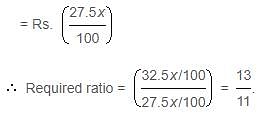
and total expenditure on taxes and interest on loans

    = Rs. [(10 + 17.5)% of x]

    = Rs. [27.5% of x]

MCQ: Bar Charts - 2 - Question 5

Direction: The bar graph given below shows the percentage distribution of the total expenditures of a company under various expense heads during 2003.

Q. The expenditure on the interest on loans is by what percent more than the expenditure on transport?

Detailed Solution for MCQ: Bar Charts - 2 - Question 5

Let the total amount of expenditures be Rs. x.
Then, the expenditure on interest on loans =
Rs. (17.5% of x) = Rs.(17.5x /100)
and the expenditure on transport = Rs. (12.5% of x)

∴ Difference between the two expenditures 


and so, the required percentage

MCQ: Bar Charts - 2 - Question 6

The bar graph given below shows the sales of books (in thousand number) from six branches of a publishing company during two consecutive years 2000 and 2001.
Sales of Books (in thousand numbers) from Six Branches - B1, B2, B3, B4, B5 and B6 of a publishing Company in 2000 and 2001.
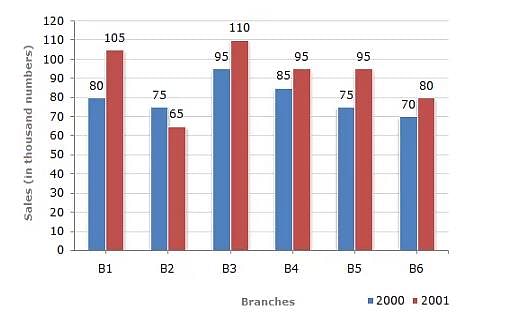
Q. What is the ratio of the total sales of branch B2 for both years to the total sales of branch B4 for both years?

Detailed Solution for MCQ: Bar Charts - 2 - Question 6

MCQ: Bar Charts - 2 - Question 7

The bar graph given below shows the sales of books (in thousand number) from six branches of a publishing company during two consecutive years 2000 and 2001.
Sales of Books (in thousand numbers) from Six Branches - B1, B2, B3, B4, B5 and B6 of a publishing Company in 2000 and 2001.

Q. What is the average sales of all the branches (in thousand numbers) for the year 2000?

Detailed Solution for MCQ: Bar Charts - 2 - Question 7

Average sales of all the six branches (in thousand numbers) for the year 2000

= 80

MCQ: Bar Charts - 2 - Question 8

The bar graph given below shows the sales of books (in thousand number) from six branches of a publishing company during two consecutive years 2000 and 2001.
Sales of Books (in thousand numbers) from Six Branches - B1, B2, B3, B4, B5 and B6 of a publishing Company in 2000 and 2001.
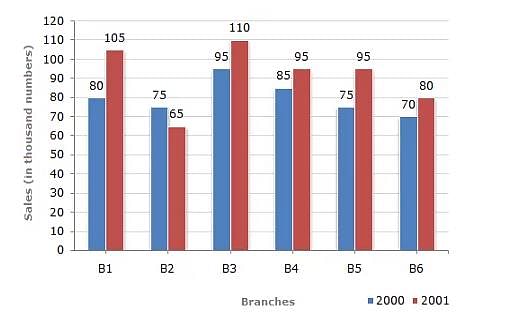
Q. What percent of the average sales of branches B1, B2 and B3 in 2001 is the average sales of branches B1, B3 and B6 in 2000?

Detailed Solution for MCQ: Bar Charts - 2 - Question 8

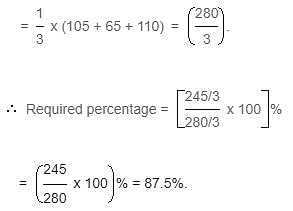
Average sales (in thousand number) of branches B1, B3 and B6 in 2000

Average sales (in thousand number) of branches B1, B2 and B3 in 2001

MCQ: Bar Charts - 2 - Question 9

The bar graph given below shows the sales of books (in thousand number) from six branches of a publishing company during two consecutive years 2000 and 2001.
Sales of Books (in thousand numbers) from Six Branches - B1, B2, B3, B4, B5 and B6 of a publishing Company in 2000 and 2001.
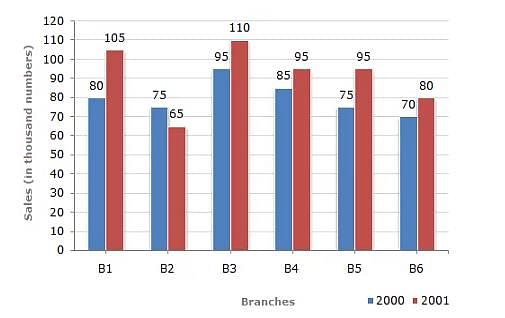
Q. Total sales of branch B6 for both the years is what percent of the total sales of branches B3 for both the years?

Detailed Solution for MCQ: Bar Charts - 2 - Question 9

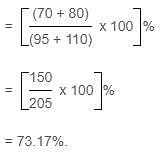
Required percentage

MCQ: Bar Charts - 2 - Question 10

The bar graph given below shows the sales of books (in thousand number) from six branches of a publishing company during two consecutive years 2000 and 2001.
Sales of Books (in thousand numbers) from Six Branches - B1, B2, B3, B4, B5 and B6 of a publishing Company in 2000 and 2001.
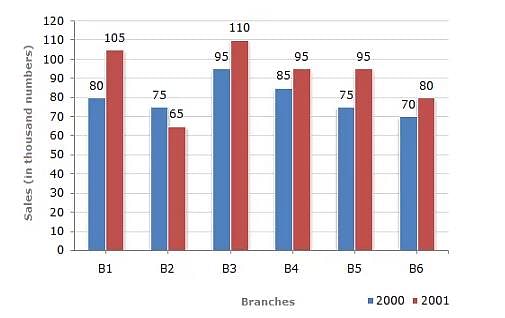
Q. Total sales of branches B1, B3 and B5 together for both the years (in thousand numbers) is?

Detailed Solution for MCQ: Bar Charts - 2 - Question 10

Total sales of branches B1, B3 and B5 for both the years (in thousand numbers)

= (80 + 105) + (95 + 110) + (75 + 95)

= 560.

MCQ: Bar Charts - 2 - Question 11

The bar graph given below shows the foreign exchange reserves of a country (in million US $) from 1991 - 1992 to 1998 - 1999.
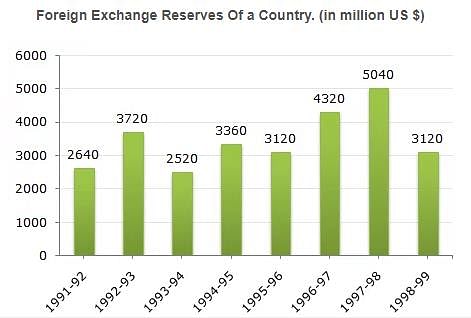
Q. For which year, the percent increase of foreign exchange reserves over the previous year, is the highest?

Detailed Solution for MCQ: Bar Charts - 2 - Question 11

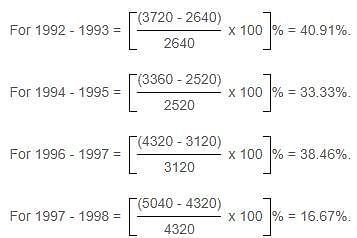
There is an increase in foreign exchange reserves during the years 1992 - 1993, 1994 - 1995, 1996 - 1997, 1997 - 1998 as compared to previous year (as shown by bar-graph).

The percentage increase in reserves during these years compared to previous year are:

Clearly, the percentage increase over previous year is highest for 1992 - 1993.

MCQ: Bar Charts - 2 - Question 12

The bar graph given below shows the foreign exchange reserves of a country (in million US $) from 1991 - 1992 to 1998 - 1999.
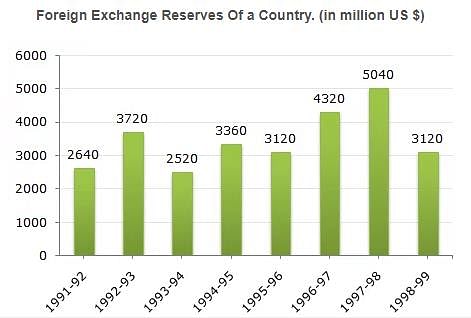
Q. What was the percentage increase in the foreign exchange reserves in 1997-98 over 1993-94?

Detailed Solution for MCQ: Bar Charts - 2 - Question 12

Foreign exchange reserves in 1997 - 1998 = 5040 million US $.

Foreign exchange reserves in 1993 - 1994 = 2520 million US $.

Therefore Increase = (5040 - 2520) = 2520 US $.

MCQ: Bar Charts - 2 - Question 13

The bar graph given below shows the foreign exchange reserves of a country (in million US $) from 1991 - 1992 to 1998 - 1999.
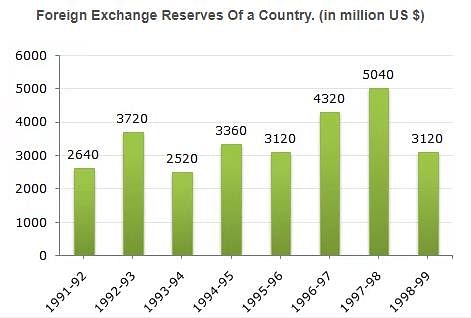
Q. The foreign exchange reserves in 1996-97 were approximately what percent of the average foreign exchange reserves over the period under review?

Detailed Solution for MCQ: Bar Charts - 2 - Question 13

Average foreign exchange reserves over the given period
= [1/8 x (2640 + 3720 + 2520 + 3360 + 3120 + 4320 + 5040 + 3120)] million US $
= 3480 million US $.

Foreign exchange reserves in 1996 - 1997 

= 4320 million US $.

MCQ: Bar Charts - 2 - Question 14

The bar graph given below shows the foreign exchange reserves of a country (in million US $) from 1991 - 1992 to 1998 - 1999.
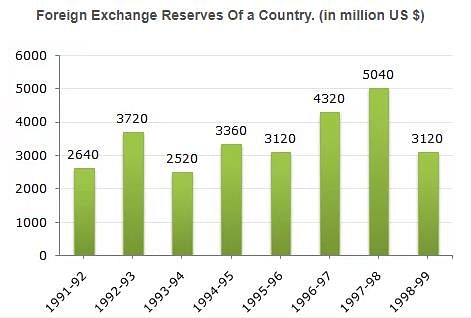
Q. The ratio of the number of years, in which the foreign exchange reserves are above the average reserves, to those in which the reserves are below the average reserves is?

Detailed Solution for MCQ: Bar Charts - 2 - Question 14

Average foreign exchange reserves over the given period = 3480 million US $.

The country had reserves above 3480 million US $ during the years 1992-93, 1996-97 and 1997-98, i.e., for 3 years and below 3480 million US $ during the years 1991-92, 1993-94, 1994-95, 1995-56 and 1998-99 i.e., for 5 years.

Hence, required ratio = 3 : 5.

MCQ: Bar Charts - 2 - Question 15

The bar graph given below shows the foreign exchange reserves of a country (in million US $) from 1991 - 1992 to 1998 - 1999.
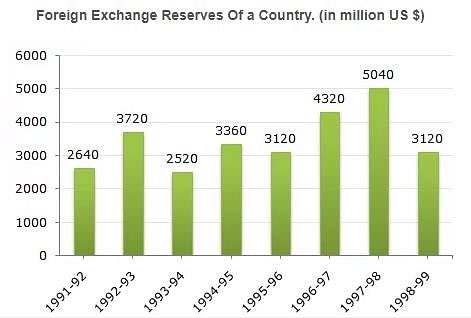
Q. The foreign exchange reserves in 1997-98 was how many times that in 1994-95?

Detailed Solution for MCQ: Bar Charts - 2 - Question 15

314 videos|170 docs|185 tests
Information about MCQ: Bar Charts - 2 Page
In this test you can find the Exam questions for MCQ: Bar Charts - 2 solved & explained in the simplest way possible. Besides giving Questions and answers for MCQ: Bar Charts - 2, EduRev gives you an ample number of Online tests for practice

Top Courses for SSC CGL

314 videos|170 docs|185 tests
Download as PDF

Top Courses for SSC CGL