Test: Data Handling - 1 - Class 5 MCQ
10 Questions MCQ Test Mathematics for Class 5 - Test: Data Handling - 1

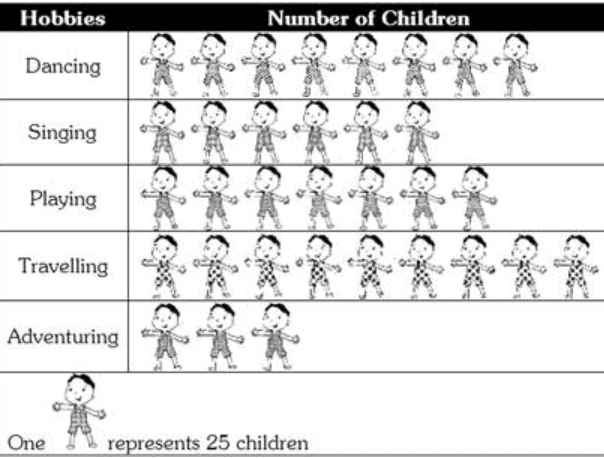
Find the number of children whose hobby is either travelling or adventuring?
| 1 Crore+ students have signed up on EduRev. Have you? Download the App |
The marks obtained in 4 subjects in an examination are 200. If the average of marks obtained in 3 subjects is 48, then how many marks are obtained in fourth subject?
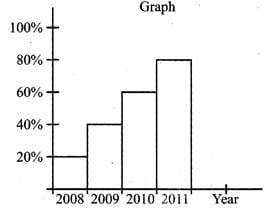
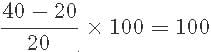
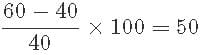
From the following graph determine which year faced maximum price rise in India in comparison to the preceding are:
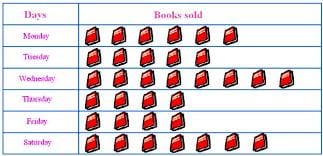
If, ↑ represents 5 houses, then the number of houses represented by↑↑↑↑ are:
The bar graph shows the grades obtained by a group of pupils in a test.
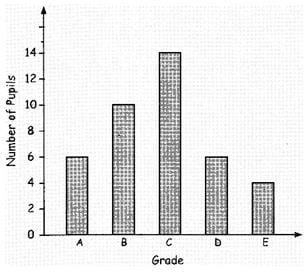
If grade C is the passing mark, how many pupils passed the test?
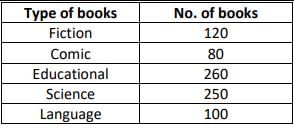
The following table shows the number of books in various categories in a kid’s library. From the table, there are _____ more books in the Fiction category than in the Language category.
|
58 videos|122 docs|40 tests
|
|
58 videos|122 docs|40 tests
|
Top Courses for Class 5


Important Questions for Data Handling - 1
Data Handling - 1 MCQs with Answers
Online Tests for Data Handling - 1 Mathematics for Class 5
|
© EduRev
|
Education Revolution
|


Follow Us
|


