Class 9 Exam  >  Class 9 Tests  >  Science Class 9  >  Lakhmir Singh & Manjit Kaur Test: Motion - Class 9 MCQ

Lakhmir Singh & Manjit Kaur Test: Motion - Class 9 MCQ


Test Description

20 Questions MCQ Test Science Class 9 - Lakhmir Singh & Manjit Kaur Test: Motion

Lakhmir Singh & Manjit Kaur Test: Motion for Class 9 2024 is part of Science Class 9 preparation. The Lakhmir Singh & Manjit Kaur Test: Motion questions and answers have been prepared according to the Class 9 exam syllabus.The Lakhmir Singh & Manjit Kaur Test: Motion MCQs are made for Class 9 2024 Exam. Find important definitions, questions, notes, meanings, examples, exercises, MCQs and online tests for Lakhmir Singh & Manjit Kaur Test: Motion below.
Solutions of Lakhmir Singh & Manjit Kaur Test: Motion questions in English are available as part of our Science Class 9 for Class 9 & Lakhmir Singh & Manjit Kaur Test: Motion solutions in Hindi for Science Class 9 course. Download more important topics, notes, lectures and mock test series for Class 9 Exam by signing up for free. Attempt Lakhmir Singh & Manjit Kaur Test: Motion | 20 questions in 20 minutes | Mock test for Class 9 preparation | Free important questions MCQ to study Science Class 9 for Class 9 Exam | Download free PDF with solutions
Lakhmir Singh & Manjit Kaur Test: Motion - Question 1

A vector quantity has

Detailed Solution for Lakhmir Singh & Manjit Kaur Test: Motion - Question 1

Vector Quantity

  • Direction: A vector quantity has a specific direction in space. This means that not only does it have a magnitude, but it also has a specific orientation or direction in which it is pointing.
  • Magnitude: In addition to having a direction, a vector quantity also has a magnitude. This magnitude represents the size or strength of the vector, indicating how much of the quantity is present.
  • Both Magnitude and Direction: Therefore, a vector quantity possesses both magnitude and direction, distinguishing it from scalar quantities which only have magnitude. This dual nature of vectors allows for a more detailed description of physical quantities.

  •  
Lakhmir Singh & Manjit Kaur Test: Motion - Question 2

The slope of the x - t graph is a measure of

Detailed Solution for Lakhmir Singh & Manjit Kaur Test: Motion - Question 2

1 Crore+ students have signed up on EduRev. Have you? Download the App
Lakhmir Singh & Manjit Kaur Test: Motion - Question 3

Odometer of automobiles records

Detailed Solution for Lakhmir Singh & Manjit Kaur Test: Motion - Question 3

Odometer of automobiles records distance travelled: The primary function of an odometer in automobiles is to measure and display the total distance the vehicle has traveled since it was first put into use. This distance is usually displayed in kilometers or miles depending on the unit system used in the region.


Lakhmir Singh & Manjit Kaur Test: Motion - Question 4

Motion of bodies A and B is depicted by the x-t graph. Then which of the following is/are incorrect

A: A has uniform motion.
B: B has less velocity than A initially
C: B crosses A at X
D: A comes to rest at X

Detailed Solution for Lakhmir Singh & Manjit Kaur Test: Motion - Question 4

According to the graph given, the body A does not have uniform motion. An object is said to be in uniform motion when it covers equal distances in equal intervals of time. In this case, it accelerates to a particular velocity and remains the same continuously. Otherwise, it is evident that the velocity of B is lesser that A initially and the body B crosses A at X.
Hence, the statement A has uniform motion is not correct.

Lakhmir Singh & Manjit Kaur Test: Motion - Question 5

The speedometer of a car measures

Detailed Solution for Lakhmir Singh & Manjit Kaur Test: Motion - Question 5

Speedometer Measurement
- Instantaneous Speed: The speedometer of a car measures the instantaneous speed at any given moment.
- It provides a real-time reading of how fast the car is moving at that particular moment.
- This measurement is important for drivers to ensure they are following speed limits and driving safely.
- It helps drivers make adjustments to their speed based on road conditions, traffic, and other factors.

Lakhmir Singh & Manjit Kaur Test: Motion - Question 6

​ From the x - t graph, one can draw the following conclusions ;

A: vOA < vAB
B: vBC is negative
C: vCD is the least by magnitude
D: acceleration is uniform

Detailed Solution for Lakhmir Singh & Manjit Kaur Test: Motion - Question 6

Option C is correct.
Explanation:

  • Statement A: From the x-t graph, the slope of the line OA represents the velocity vOA, which is less than the velocity vAB. This is because the slope of the line AB is steeper than the slope of line OA, indicating a higher velocity.
  • Statement B: The velocity vBC is negative because the slope of the line BC is negative, indicating motion in the negative direction on the x-axis.
  • Statement C: The velocity vCD is the least by magnitude because the slope of the line CD is the least steep, indicating the smallest velocity compared to the other sections of the graph.
  • Statement D: The x-t graph does not provide information about acceleration. It only shows velocity changes over time. Therefore, statement D is not correct.
Lakhmir Singh & Manjit Kaur Test: Motion - Question 7

If the displacement-time graph of a particle is parallel to the time axis, the velocity of the particle is

Detailed Solution for Lakhmir Singh & Manjit Kaur Test: Motion - Question 7

Option C is the correct option.

When the displacement-time graph is parallel to the time axis, the velocity of the particle is zero because the particle is at rest and its displacement is not changing with time.

Lakhmir Singh & Manjit Kaur Test: Motion - Question 8

In a uniformly accelerated motion,
A: v - t graph is a straight line not parallel to t or v axis.
B: x - t graph is not a straight line.
C: Slope of v - t graph varies.
D: Slope of x - t graph is constant.

Detailed Solution for Lakhmir Singh & Manjit Kaur Test: Motion - Question 8

The correct answer is: Only A and B are correct

Lakhmir Singh & Manjit Kaur Test: Motion - Question 9

The velocity time graph of a moving particle is shown in Figure, The acceleration of the particle is

Detailed Solution for Lakhmir Singh & Manjit Kaur Test: Motion - Question 9

Explanation:

Velocity-Time Graph Analysis:
- The slope of the velocity-time graph gives the acceleration of the particle.
- If the velocity-time graph is a straight line, the acceleration is constant.
- The acceleration can be calculated by finding the slope of the line.

Calculating Acceleration:
- The acceleration can be calculated using the formula: acceleration = change in velocity / change in time.
- By looking at the graph, we can see that the change in velocity is 10 m/s and the change in time is 4 seconds.

Acceleration Calculation:
- acceleration = change in velocity/ time
- acceleration = 10-5 / 2 = 2.5 m/s2

Therefore, the acceleration of the particle is 2.5 m/s2. Hence, the correct answer is option D: 2.5 m/s2

Lakhmir Singh & Manjit Kaur Test: Motion - Question 10

If the velocity of a body is reducing, it is said to have

Detailed Solution for Lakhmir Singh & Manjit Kaur Test: Motion - Question 10

The correct answer is D: Both (a) and (b).

  • Acceleration is the rate of change of velocity. It can be positive (increasing velocity) or negative (decreasing velocity).
  • Retardation is another term specifically used for negative acceleration. It describes a situation where the velocity is slowing down.

Therefore, when the velocity of a body is reducing, it has both:

  • Negative acceleration: Because the change in velocity is negative.
  • Retardation: Because it's the specific term for negative acceleration in the context of slowing down.
Lakhmir Singh & Manjit Kaur Test: Motion - Question 11

The velocity time (v - t) graph of a moving particle is shown in Figure. The acceleration is maximum for segment

Detailed Solution for Lakhmir Singh & Manjit Kaur Test: Motion - Question 11

Option B is correct .

The maximum acceleration occurs during segment B to C as it has the steepest slope on the graph, representing the highest rate of change of velocity.

Lakhmir Singh & Manjit Kaur Test: Motion - Question 12

 One can conclude from the given x-t graph that

Detailed Solution for Lakhmir Singh & Manjit Kaur Test: Motion - Question 12

Option A is correct.

Explanation:

  • From the x-t graph, we can see that the velocity of object A (VA) is greater than the velocity of object B (VB) at point x1.
  • If the slope of the tangent for A is greater than the slope of the tangent for B at x1, then VA> VB at that point.
Lakhmir Singh & Manjit Kaur Test: Motion - Question 13

The numerical ratio of displacement to distance for a moving object is

Detailed Solution for Lakhmir Singh & Manjit Kaur Test: Motion - Question 13

Explanation:

Displacement is the straightest shot (shortest distance) between start and end. Distance is the total path taken. Imagine going for a walk around a block - the displacement is the length of one side, while the distance is the entire walk. The numerical ratio of displacement to distance is calculated as displacement divided by distance. So the ratio:

  • Can be 1 (straight path)
  • Is less than 1 (curved path or going back and forth)
  • Never more than 1

Therefore, the answer is D: equal to or less than 1.

Lakhmir Singh & Manjit Kaur Test: Motion - Question 14

A body starting at a point, say A, reaches, say B, ahead in a straight line and returns back to A. Then there is

Detailed Solution for Lakhmir Singh & Manjit Kaur Test: Motion - Question 14

The correct answer is C: zero displacement.

Explanation: 

  • Displacement is the straight line distance between the starting and ending points of an object's motion.
  • In this scenario, the body starts at A, goes to B, and then returns to A. Even though the body travels a certain distance (twice the distance between A and B), it ends up back at its starting point (A).
  • Since displacement considers the net change in position, and the body ends at the same point it started, the displacement is zero.
Lakhmir Singh & Manjit Kaur Test: Motion - Question 15

From the given v - t graph, it can be inferred that the object is

Detailed Solution for Lakhmir Singh & Manjit Kaur Test: Motion - Question 15

In the given graph we find that the velocity is constant throughout, hence the object represented in the v - t graph is said to be in uniform motion.  Zero acceleration is also called uniform acceleration.

Lakhmir Singh & Manjit Kaur Test: Motion - Question 16

What does a steep slope on a distance-time graph indicate?

Detailed Solution for Lakhmir Singh & Manjit Kaur Test: Motion - Question 16

Option B is correct. 

In a distance-time graph, the slope or gradient. The greater the gradient, the greater the rate of change. of the line is equal to the speed of the object. The steeper the line (and the greater the gradient) the faster the object is moving.

Lakhmir Singh & Manjit Kaur Test: Motion - Question 17

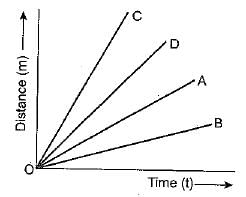
Four cars A, B, C and D are moving on a levelled road. Their distance versus time graphs are shown in figure.
Choose the correct statement.
Detailed Solution for Lakhmir Singh & Manjit Kaur Test: Motion - Question 17

Option B is correct. Car B is the slowest
-Car B covers the least distance in the same amount of time compared to the other cars, making it the slowest among the four.

Lakhmir Singh & Manjit Kaur Test: Motion - Question 18

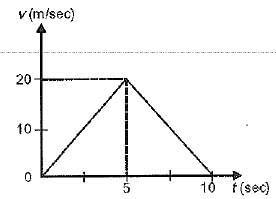
The displacement of the body in 5 seconds from the beginning of the motion is
Detailed Solution for Lakhmir Singh & Manjit Kaur Test: Motion - Question 18

Displacement = Area of ΔABC

Lakhmir Singh & Manjit Kaur Test: Motion - Question 19

Suppose a boy is enjoying a ride on a merry go round which is moving with a constant speed of 10 ms-1. It implies that the boy is

Detailed Solution for Lakhmir Singh & Manjit Kaur Test: Motion - Question 19

Acceleration is the measure of how fast the velocity changes. Velocity is a vector quantity and a change in velocity is due to  change in magnitude or change in direction or both. Here,  the boy is moving with constant speed but velocity changes and hence is supposed to be in accelerated motion. 

Lakhmir Singh & Manjit Kaur Test: Motion - Question 20

The v-t graph shown here does not  depicts the motion of A and B such that

Detailed Solution for Lakhmir Singh & Manjit Kaur Test: Motion - Question 20

Explanation:
Velocity-Time Graph Analysis:
The velocity-time graph shown depicts the motion of objects A and B.The collision between A and B occurs when their velocity is 10 ms1.

Interpreting the Graph:The graph shows that the velocity of object A exceeds 10 ms-1 at a certain point.This indicates that object A is moving faster than 10 ms-1 at that point.

Acceleration Analysis:Since the velocity of object A exceeds 10 ms-1, it implies that object A is accelerating.
Similarly, the behavior of object B on the graph also indicates non-zero acceleration.

Conclusion:
- Based on the analysis of the velocity-time graph, it can not  be concluded that both objects A and B have non-zero acceleration.
- Therefore, the correct answer is option B: both A and B have non-zero acceleration.

87 videos|369 docs|68 tests
Information about Lakhmir Singh & Manjit Kaur Test: Motion Page
In this test you can find the Exam questions for Lakhmir Singh & Manjit Kaur Test: Motion solved & explained in the simplest way possible. Besides giving Questions and answers for Lakhmir Singh & Manjit Kaur Test: Motion, EduRev gives you an ample number of Online tests for practice

Up next

87 videos|369 docs|68 tests
Download as PDF

Up next