Class 5 Exam  >  Class 5 Tests  >  Mathematics for Class 5: NCERT  >  Test: Smart Charts - 2 - Class 5 MCQ

Test: Smart Charts - 2 - Class 5 MCQ


Test Description

10 Questions MCQ Test Mathematics for Class 5: NCERT - Test: Smart Charts - 2

Test: Smart Charts - 2 for Class 5 2024 is part of Mathematics for Class 5: NCERT preparation. The Test: Smart Charts - 2 questions and answers have been prepared according to the Class 5 exam syllabus.The Test: Smart Charts - 2 MCQs are made for Class 5 2024 Exam. Find important definitions, questions, notes, meanings, examples, exercises, MCQs and online tests for Test: Smart Charts - 2 below.
Solutions of Test: Smart Charts - 2 questions in English are available as part of our Mathematics for Class 5: NCERT for Class 5 & Test: Smart Charts - 2 solutions in Hindi for Mathematics for Class 5: NCERT course. Download more important topics, notes, lectures and mock test series for Class 5 Exam by signing up for free. Attempt Test: Smart Charts - 2 | 10 questions in 10 minutes | Mock test for Class 5 preparation | Free important questions MCQ to study Mathematics for Class 5: NCERT for Class 5 Exam | Download free PDF with solutions
Test: Smart Charts - 2 - Question 1

Direction: Study the graph and answer the question.
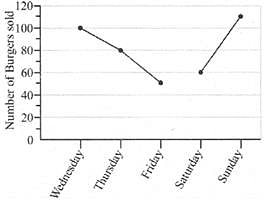
Q. If a profit of Rs. 12 was made for every burger sold, then how much profit was made on Thursday?

Detailed Solution for Test: Smart Charts - 2 - Question 1

On Thursday Total burgers sold = 80
On selling 1 burger profit is = Rs. 12
On selling 80 burgers profit is =  Rs. 12 x 80 = Rs.960

Test: Smart Charts - 2 - Question 2

Direction: The bar graph shows the mass of 5 children.
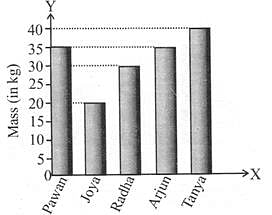
Q. What is the difference between the mass of the heaviest child and the lightest child?

Detailed Solution for Test: Smart Charts - 2 - Question 2

We can interpret from graph that Tanya is the Heaviest child =40 kg
And the highest child is Joya = 20 kg
So difference = 40 kg - 20 kg = 20 kg

1 Crore+ students have signed up on EduRev. Have you? Download the App
Test: Smart Charts - 2 - Question 3

Direction: The bar graph shows the mass of 5 children.
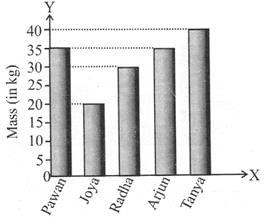
Q. Which of the two children have the same mass?

Detailed Solution for Test: Smart Charts - 2 - Question 3

From the graph, the two bars corresponding to the mass of Pawan and Arjun are of the same height. So, Pawan and Arjun have the same mass.

Test: Smart Charts - 2 - Question 4

Direction: The bar graph shows the mass of 5 children.

Q. What is the difference between the mass of the heaviest child and the lightest child?

Detailed Solution for Test: Smart Charts - 2 - Question 4

Tanya weighs 40 kg and Joya weighs 20 kg, making Tanya 20 kg heavier than Joya.

Test: Smart Charts - 2 - Question 5

Direction: The graph shows how Lalit spends his pocket money each month.
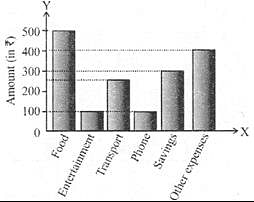
Q. The amount spent on food is how many times the amount spent on transport?

Detailed Solution for Test: Smart Charts - 2 - Question 5

Amount spent on Food = 500
Amount spent on Transport = 250
So Money spent on food is 2 x 250 in other words double or twice the money spent on transport.

Test: Smart Charts - 2 - Question 6

Direction: The graph shows how Lalit spends his pocket money each month.
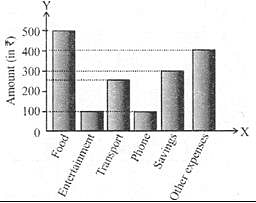
Q. What is the fraction of the amount spent on other expenses to the amount spent on food?

Detailed Solution for Test: Smart Charts - 2 - Question 6

Amount of money spent on other expenses = 400
Amount of money spent on food = 500
Fraction = 400/ 500 = 4/5

Test: Smart Charts - 2 - Question 7

Direction: The graph shows how Lalit spends his pocket money each month.
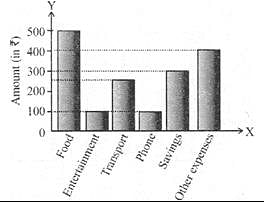
How much does Lalit earn per month?

Detailed Solution for Test: Smart Charts - 2 - Question 7

Total Money= Food+ Entertainment+Transport+Phone+Savings+Other Expenses
                   = 500+100+250+100+300+400
                   =1650

Test: Smart Charts - 2 - Question 8

Direction: The line graph shows the money earned by a fruit seller during a certain week.
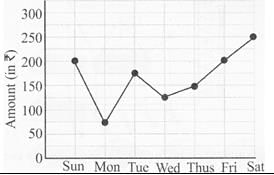
On which day did he earn Rs.75 less than the amount earned on Thursday?

Detailed Solution for Test: Smart Charts - 2 - Question 8

Amount earned on Thursday = Rs. 150 

∴  Rs. 75 less than Rs.150 is Rs. 75 = Amount earned on Monday

Test: Smart Charts - 2 - Question 9
On which day did the fruit seller earn the most money according to the graph?
Detailed Solution for Test: Smart Charts - 2 - Question 9
The line graph shows that the earnings peak on Saturday, reaching the highest value compared to other days of the week. The point corresponding to Saturday is the highest on the graph, indicating the maximum earnings.
Test: Smart Charts - 2 - Question 10

How much did the fruit seller's earnings decrease from Tuesday to Wednesday?

Detailed Solution for Test: Smart Charts - 2 - Question 10

From the line graph, it is evident that the earnings on Tuesday were approximately ₹175, and on Wednesday, they were about ₹125. Therefore, the decrease in earnings from Tuesday to Wednesday was:
₹175 - ₹125 = ₹ 50 

28 videos|169 docs|41 tests
Information about Test: Smart Charts - 2 Page
In this test you can find the Exam questions for Test: Smart Charts - 2 solved & explained in the simplest way possible. Besides giving Questions and answers for Test: Smart Charts - 2, EduRev gives you an ample number of Online tests for practice

Top Courses for Class 5

28 videos|169 docs|41 tests
Download as PDF

Top Courses for Class 5