Olympiad Test Level 1: Quantitative Aptitude & Reasoning- 1 - Class 7 MCQ
10 Questions MCQ Test GK Olympiad for Class 7 - Olympiad Test Level 1: Quantitative Aptitude & Reasoning- 1

What is the value of 0 - 1 + 2 - 3 + 4 - 5 + 6 - 7 ........... - 17 + 18 - 19 + 20?
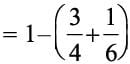
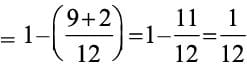
In a box, (3/4)th of the balls are red, (1/6)th are white and the rest are blue. If there are 3 blue balls in the box, how many are red?
| 1 Crore+ students have signed up on EduRev. Have you? Download the App |
An insect crawls up 5 cm every second on a 60 cm vertical rod and then falls down 2 cm over the next second. How many seconds will it take to climb the rod?
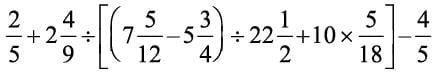
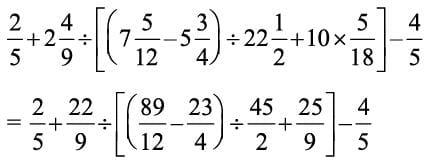
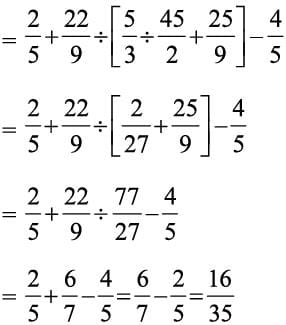
Calculate the value of
Directions: The total sales of a company (in crores) for different years are given in the following bar graph. Study the bar graph carefully and answer the following question.

Q. In which year the sales of the company was maximum?
Directions: The total sales of a company (in crores) for different years are given in the following bar graph. Study the bar graph carefully and answer the following question.
Q. In which year the sales of the company was minimum?
Directions: The total sales of a company (in crores) for different years are given in the following bar graph. Study the bar graph carefully and answer the following question.
Q. The percentage decrease in total sales in year 2009 to that in year 2008 is:
Directions: The total sales of a company (in crores) for different years are given in the following bar graph. Study the bar graph carefully and answer the following question.
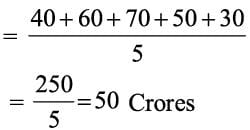
Q. The average sales during these five years is:
Directions: The total sales of a company (in crores) for different years are given in the following bar graph. Study the bar graph carefully and answer the following question.
Q. The ratio of the total sales in the year 2005 to that in the year 2009 is:
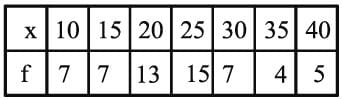
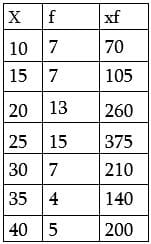
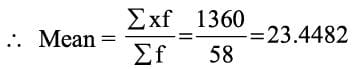
Find the mean of the following distribution.
|
7 docs|68 tests
|


Important Questions for Olympiad Test Level 1: Quantitative Aptitude & Reasoning- 1
Olympiad Test Level 1: Quantitative Aptitude & Reasoning- 1 MCQs with Answers
Online Tests for Olympiad Test Level 1: Quantitative Aptitude & Reasoning- 1 GK Olympiad for Class 7
|
© EduRev
|
Education Revolution
|


|


